
Malaysia Import Export Data 2026 | Complete Trade Guide
Home › Blog › Malaysia Import Export Data 2026 Malaysia Trade Intelligence 2026 Malaysia Import Export Data 2026: Complete Guide to Trade Statistics, HS Codes & Market Insights Malaysia is one of Asia’s most dynamic trading nations — and accessing accurate Malaysia import export data is essential for businesses targeting this high-growth market. This complete guide covers Malaysia’s top traded products, key HS codes, major trading partners, customs procedures, and how to use trade intelligence for sourcing, compliance, and market entry in 2026. Updated: April 2026 14 min read Malaysia Trade Data $290B+Total Export Value 2025 $225B+Total Import Value 2025 $65B+Trade Surplus 2025 220+Global Trading Partners MT Malaysia Trade Data Research Team — Data Vault Trade Intelligence Analysts · Published April 23, 2026 · 14 min read Malaysia stands as one of Southeast Asia’s most strategically important trading economies. Understanding Malaysia import export data in 2026 is therefore essential for any business operating within — or targeting — this high-growth market. Whether you are an exporter seeking Malaysian buyers, an importer sourcing Malaysian goods, or an analyst building regional supply chain models, this comprehensive guide delivers the intelligence you need. Furthermore, Malaysia’s trade profile is uniquely diversified — spanning high-tech electronics, palm oil, petroleum, machinery, and a rapidly growing services export sector. As a result, Malaysia trade data is closely monitored by global commodity traders, semiconductor supply chain managers, and ASEAN market researchers alike. Consequently, platforms that provide verified, shipment-level Malaysia import export intelligence have become critical business tools in 2026. Malaysia Trade Overview 2026 Malaysia’s total trade volume exceeded $515 billion in 2025, maintaining the country’s position as one of the world’s top 25 trading nations. The country runs a consistent trade surplus — approximately $65 billion in 2025 — driven by strong electronics and petroleum exports. Additionally, Malaysia’s integration into major free trade agreements, including RCEP, CPTPP, ATIGA, and a growing network of bilateral FTAs, provides preferential market access across dozens of major economies worldwide. Why Malaysia Trade Data Matters for Global Businesses Malaysia occupies a unique structural position in global supply chains. On one hand, it is a major importer of semiconductor components, machinery, and petroleum — inputs that feed its world-class electronics and petrochemical manufacturing sectors. On the other hand, it is simultaneously a dominant exporter of finished electronics, palm oil, rubber, and oleochemicals. Therefore, Malaysia import export data captures both sides of this dynamic — making it simultaneously useful for exporters targeting Malaysian buyers AND importers sourcing Malaysian-manufactured goods. Key Insight for 2026: Malaysia’s trade-to-GDP ratio exceeds 130% — one of the highest in Asia. This means the country’s economy is deeply integrated with global markets. Consequently, tracking Malaysia trade statistics provides a leading indicator of regional supply chain health across the broader ASEAN ecosystem. Moreover, because Malaysia sits at the intersection of multiple major trade routes, disruptions or expansions in Malaysian trade frequently signal broader shifts in Asian manufacturing activity. Malaysia’s Trade Surplus: What It Means for Exporters A $65 billion trade surplus indicates that Malaysia consistently exports significantly more than it imports by value. However, this surplus is not evenly distributed across all product categories. In electronics, for instance, Malaysia runs a massive surplus — exporting far more than it imports. In contrast, for food products, the country runs a deficit, importing large volumes of rice, wheat, and dairy products. Understanding these category-level dynamics is therefore critical for businesses deciding where to focus their Malaysia trade strategy. Malaysia’s Top Export Products 2026 Malaysia’s export portfolio is one of the most diversified in Southeast Asia. Nevertheless, electronics consistently dominates, accounting for approximately 38% of total merchandise export value. Here is a breakdown of the leading export categories in Malaysia export data 2026: # Export Category HS Chapter Export Value (2025) YoY Growth Status 1 Electrical Machinery & Electronics HS 85 $110.4B +9.2% Dominant 2 Petroleum & Mineral Products HS 27 $42.6B +3.1% Stable 3 Palm Oil & Oleochemicals HS 15, 38 $18.2B +5.4% Stable 4 Machinery & Mechanical Appliances HS 84 $16.8B +7.8% Growing 5 Chemicals & Chemical Products HS 28–29 $12.4B +6.2% Growing 6 Rubber & Rubber Products HS 40 $6.8B +2.9% Stable 7 Optical & Medical Instruments HS 90 $5.6B +11.4% Fast Growing 8 Plastics & Plastic Articles HS 39 $4.9B +4.8% Stable Electronics: The Engine of Malaysia’s Export Growth At $110.4 billion, electronics (HS Chapter 85) is by far the largest export category in Malaysia export data. Furthermore, this dominance is structural rather than cyclical — Malaysia hosts some of the world’s largest semiconductor packaging and testing operations, including Intel’s largest facility outside the United States and major plants operated by Infineon, Texas Instruments, and Western Digital. As a result, even when global electronics demand fluctuates, Malaysia maintains its export volumes through long-term supply agreements with major technology companies. Palm Oil: Malaysia’s Agricultural Export Powerhouse Palm oil and oleochemicals at $18.2 billion represent Malaysia’s most globally recognized agricultural export. However, the sector faces growing regulatory pressure — particularly from the EU Deforestation Regulation (EUDR) — which has caused some trade diversion from European markets toward India, China, and Pakistan. Nevertheless, overall palm oil export value remains strong in 2026, supported by rising biodiesel demand and growing oleochemical exports to Japan and the United States. For a detailed breakdown, explore our dedicated Malaysia export data analysis and the specific Malaysia palm oil export data guide. Malaysia’s Top Import Products 2026 Malaysia’s import basket is shaped primarily by its industrial needs — specifically the electronics manufacturing sector’s massive demand for components and raw materials. Additionally, energy imports and food products round out the import profile. Here is the complete picture from Malaysia import data 2026: # Import Category HS Chapter Import Value (2025) YoY Growth Status 1 Electrical Machinery & Electronics HS 85 $62.1B +10.4% Top Category 2 Machinery & Mechanical Appliances HS 84 $31.2B +8.6% Growing 3 Petroleum & Mineral Fuels HS 27 $18.4B +2.8% Stable 4 Iron, Steel & Metal Articles HS 72–73 $9.4B +4.2% Stable 5 Plastics & Articles
Philippines Customs Duty for Electronics 2026
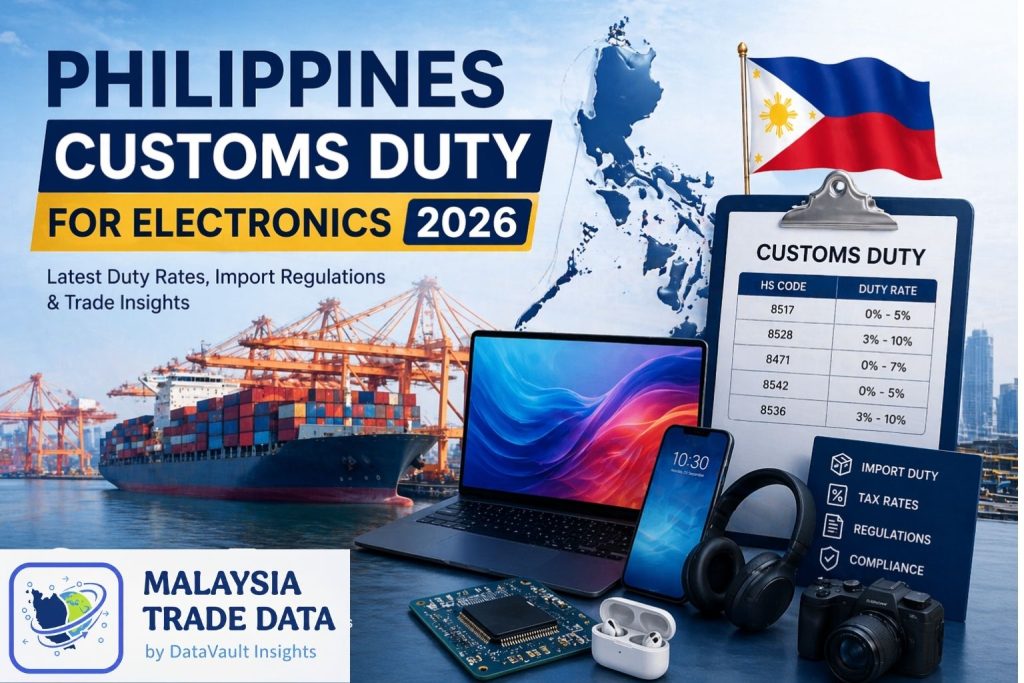
Home › Blog › Philippines Import Data › Philippines Customs Duty for Electronics 2026 Philippines Trade Guide 2026 Philippines Customs Duty for Electronics 2026: Complete HS Code & Import Tax Guide Everything importers, exporters, and trade professionals need to know about Philippines customs duty rates for electronics in 2026 — covering HS codes, MFN tariff rates, FTA preferential duties, VAT, BOC procedures, and how to access real Philippines electronics import data. Updated: April 2026 12 min read Philippines Customs Guide $28.6BPhilippines Electronics Imports 2025 0–15%MFN Duty Range HS Chapter 85 12%VAT on All Electronics Imports ATIGA0% Duty from ASEAN Partners MT Malaysia Trade Data Research Team — Data Vault Trade Intelligence Analysts · Published April 22, 2026 · 12 min read Understanding Philippines customs duty for electronics is one of the most critical requirements for businesses importing technology products into the country. Whether you are shipping laptops, semiconductors, smartphones, solar panels, or industrial electronics into the Philippines, the correct HS code classification determines your import duty rate, VAT obligation, and Bureau of Customs (BOC) compliance requirements for 2026. This comprehensive guide covers everything you need to know about Philippines electronics import duty 2026 — from HS code classifications and MFN tariff rates to FTA preferential duties and a practical step-by-step customs clearance guide. For businesses needing to access actual Philippines import data by electronics HS code, this guide also explains how to find real shipment records, importer profiles, and declared customs values from the Bureau of Customs database. Philippines Electronics Import Overview 2026 The Philippines is one of Southeast Asia’s largest electronics import markets, with total electronics import value reaching approximately $28.6 billion in 2025 — accounting for nearly 20% of the country’s total import bill. Electronics imports span a wide range — from semiconductor components and integrated circuits that feed the Philippines’ PEZA-based assembly sector, to consumer electronics, telecoms equipment, medical devices, and the rapidly growing renewable energy electronics segment. Key Insight: The Philippines electronics market has a unique dual structure — approximately 60% of electronics imports are intermediate goods (semiconductor components, ICs, PCBs) imported by PEZA-registered manufacturers for assembly and re-export. The remaining 40% are final consumer and capital goods (smartphones, laptops, industrial machinery, solar panels) imported for domestic use. The customs duty treatment — and the applicable HS codes — differ significantly between these two categories. For businesses comparing electronics import duty structures across ASEAN, the Philippines customs tariff is generally more favorable than Indonesia but higher than Singapore. Companies monitoring Indonesia import export data for electronics will find that both countries apply 0% ATIGA duties on most electronics from fellow ASEAN members, but differ in their MFN rates for non-ASEAN suppliers. Similarly, Thailand import export data for electronics shows that Thailand’s electronics processing trade at 0% MFN for most ICs mirrors Philippines treatment under the ITA Agreement. Electronics HS Codes & Duty Rates: Philippines 2026 The Philippines uses the ASEAN Harmonized Tariff Nomenclature (AHTN) for customs classification. Electronics products fall primarily under HS Chapters 84 (machinery), 85 (electrical/electronic equipment), and 90 (optical/measuring instruments). Here is the complete Philippines electronics customs duty table for the most commonly imported HS codes in 2026: HS Code Product Description MFN Duty ATIGA (ASEAN) RCEP Rate ITA Rate 8542.31 Integrated Circuits — Processors & Controllers 0% 0% 0% 0% (ITA) 8542.32 Memories — Flash, DRAM, Storage ICs 0% 0% 0% 0% (ITA) 8541.10 Diodes & Transistors 0% 0% 0% 0% (ITA) 8534.00 Printed Circuit Boards (PCBs) 0% 0% 0% 0% (ITA) 8471.30 Laptops & Portable Computers 0% 0% 0% 0% (ITA) 8471.50 Desktop Computers & Processing Units 0% 0% 0% 0% (ITA) 8517.12 Smartphones & Mobile Phones 0% 0% 0% 0% (ITA) 8517.62 Base Stations, Routers & Telecom Equipment 0–5% 0% 0% 0% (ITA) 8528.72 LCD / LED Televisions 10% 0% 5% Not covered 8519.81 Sound Recording & Streaming Equipment 10% 0% 5% Not covered 8508.11 Vacuum Cleaners & Home Appliances 10% 0% 5% Not covered 8507.60 Lithium-Ion Battery Cells & Packs 0–5% 0% 0% 0% (ITA) 8541.40 Photovoltaic Cells & Solar Panels 0–3% 0% 0% 0% (ITA) 8544.42 Electric Conductors with Connectors ≤1000V 0–5% 0% 0% 0% (ITA) 8708.99 Automotive Electronic Parts & Accessories 5–10% 0% 5% Not covered 9018.90 Medical Electronic Instruments (Other) 0–3% 0% 0% 0% (ITA) 9027.10 Gas Analysers & Electronic Test Equipment 0% 0% 0% 0% (ITA) ITA Agreement Explained: The Information Technology Agreement (ITA) — signed by the Philippines as a WTO member — eliminates customs duties to 0% MFN on 201 categories of information technology products including computers, semiconductors, telecom equipment, and related components. This means many electronics products enter the Philippines at 0% duty regardless of the country of origin — no FTA certificate of origin required. This is the single most important tariff provision for electronics importers in the Philippines. Total Import Cost: Beyond Just Customs Duty Many importers focus only on the customs duty rate when calculating Philippines electronics import costs — but the total landed cost includes several additional charges levied by the Bureau of Customs (BOC) and other agencies. Here is the complete Philippines electronics import cost breakdown for 2026: Charge Type Rate Basis Who Pays Notes Customs Duty (CD) 0–15% Customs value (CIF) Importer HS code dependent. 0% for ITA/FTA items. Value Added Tax (VAT) 12% Dutiable value + CD Importer Applied on ALL imports including 0% duty goods. Excise Tax Varies Specific or Ad valorem Importer Applies to cars, tobacco, alcohol. Most electronics exempt. Customs Processing Fee PHP 250–1,000 Per entry Importer Administrative fee per customs entry declaration. Arrastre & Wharfage ~2–4% of cargo value Cargo value Importer/Consignee Port handling charges at Manila, Cebu, Batangas. Brokerage Fee Negotiated Per shipment Importer Customs broker fee. Typically PHP 5,000–25,000 per entry. DICT/NTC Permit (electronics) PHP 500–5,000 Per product type Importer Required for telecom equipment, radio frequency devices. The 12% VAT on all electronics imports is the most universally applicable charge — even when customs duty is 0% under ITA or ATIGA, the 12% VAT still applies to the
Thailand Import-Export Information on Trade Statistics, trends & Market Information (2026)
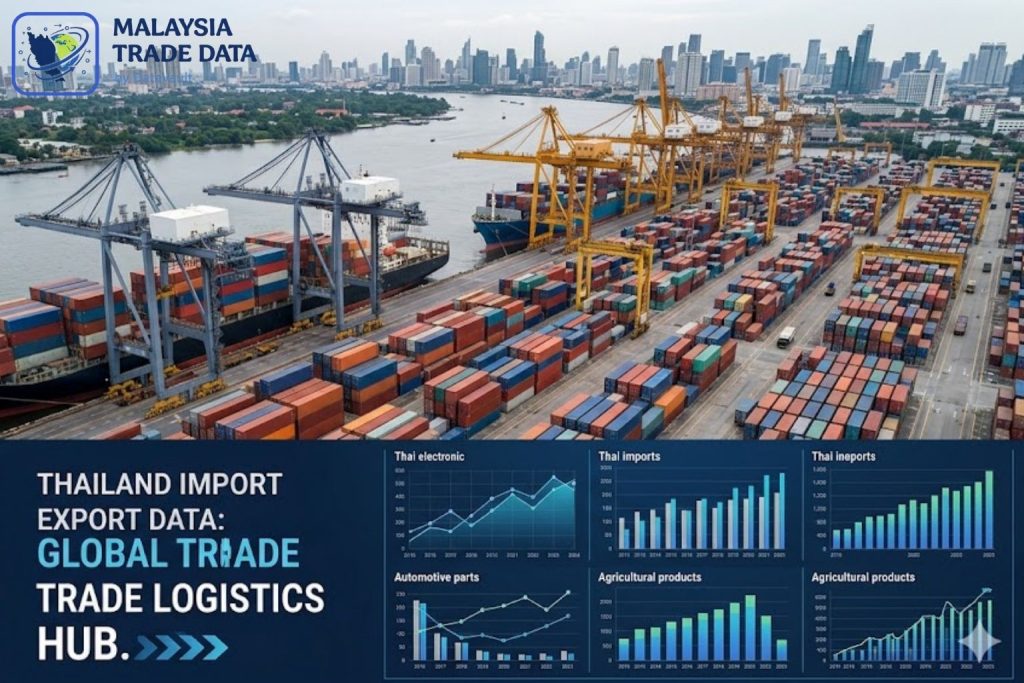
Thailand Import Export Data 2026: Trade Statistics, Trends & Market Insights Home › Trade Data › Thailand Import Export Data 2026 Trade Intelligence 2026 Thailand Import Export Data: Trade Statistics, Trends & Market Insights A deep-dive into Thailand’s 2026 trade landscape — covering top import and export commodities, key trading partners, HS code intelligence, customs data, and market opportunities for businesses targeting Southeast Asia’s second-largest economy. Updated: April 2026 13 min read Thailand Trade Data $290B+ Total Export Value (2025 est.) $270B+ Total Import Value (2025 est.) 220+ Global Trading Partners +6.8% YoY Trade Growth Rate MT Malaysia Trade Data Research Team Trade Intelligence Analysts · Published April 16, 2026 · 13 min read Thailand stands as one of Southeast Asia’s most strategically important trading nations, and Thailand import export data in 2026 reflects a mature, export-driven economy with deep supply chain ties to China, Japan, and the United States. From automotive manufacturing and electronics to agricultural commodities and petrochemicals, Thailand trade statistics reveal a highly diversified trade profile that offers significant opportunities for global businesses. Whether you are an exporter targeting Thai buyers, an importer sourcing Thai goods, a logistics professional tracking Thailand customs data, or an analyst building regional supply chain models, this comprehensive guide to Thailand trade data 2026 equips you with the intelligence you need to make informed decisions. Thailand Trade Overview 2026 Thailand’s trade-to-GDP ratio consistently exceeds 120%, making it one of the most trade-dependent economies in Asia. As a founding ASEAN member and a signatory to major trade agreements — including RCEP, ATIGA, AIFTA, and bilateral FTAs with Australia, New Zealand, Japan, China, and India — Thailand benefits from preferential market access across dozens of major economies. Key Insight: Thailand’s trade surplus has averaged $15–20 billion annually in recent years, driven by strong electronics and automotive exports. However, the country remains significantly import-dependent for energy, electronic components, and machinery — inputs that feed its massive manufacturing export sector. Tracking Thailand HS code data reveals the tight circular relationship between Thailand’s imports and its downstream export industries. For businesses already monitoring Malaysia import data or analyzing Vietnam import data, Thailand occupies a complementary position in the ASEAN trade ecosystem — often serving as both a supplier and a buyer within the same regional value chains. Understanding how Thailand fits into these networks is essential for any Southeast Asia market strategy. Thailand’s Top Imported Products (2026) Thailand’s import structure is shaped primarily by its industrial needs. The country imports massive volumes of petroleum, electronic components, machinery, steel, and chemicals to support its manufacturing and export industries. Here is a detailed breakdown of the most significant Thailand import categories by value: # Product Category HS Chapter Est. Value (2025) YoY Growth Status 1 Crude Petroleum & Mineral Fuels HS 27 $38.6B +4.1% Dominant 2 Electrical Machinery & Electronics HS 85 $34.2B +9.7% Fast Growing 3 Machinery & Mechanical Appliances HS 84 $29.8B +7.3% Fast Growing 4 Iron, Steel & Metal Products HS 72–73 $14.7B +3.8% Stable 5 Chemical Products & Organics HS 28–29 $12.4B +5.2% Stable 6 Vehicles & Automotive Parts HS 87 $9.8B +11.4% Fast Growing 7 Plastics & Articles Thereof HS 39 $8.9B +4.6% Stable 8 Precious Metals & Jewelry HS 71 $7.6B +14.2% Surging 9 Aircraft & Aerospace Parts HS 88 $5.3B +8.9% Growing 10 Optical & Medical Instruments HS 90 $4.8B +7.1% Stable Crude petroleum’s dominance in Thailand import statistics reflects the country’s energy-intensive industrial base and its role as a regional refining hub. Meanwhile, the rapid growth in electrical machinery (HS 85) and automotive parts (HS 87) underscores Thailand’s deepening integration into the global electronics and automobile supply chains — trends that are directly visible in Thailand bill of lading data and shipment-level Thailand customs records. Thailand’s Top Exported Products (2026) Thailand’s export profile is one of the most diversified in Southeast Asia, spanning high-value manufactured goods, processed food, rubber products, and precious metals. Thailand export data for 2026 highlights continued strength in electronics and automotive exports alongside a growing services trade surplus in tourism-adjacent goods. # Export Category HS Chapter Est. Value (2025) YoY Growth Status 1 Electrical Machinery & Electronics HS 85 $52.4B +8.6% Top Export 2 Vehicles, Cars & Auto Parts HS 87 $31.7B +6.4% Dominant 3 Machinery & Mechanical Appliances HS 84 $22.9B +5.8% Stable 4 Rubber & Rubber Products HS 40 $11.3B +3.1% Stable 5 Refined Petroleum Products HS 27 $10.8B +2.4% Stable 6 Prepared Food & Edible Products HS 16–21 $9.6B +4.7% Stable 7 Plastics & Petrochemical Products HS 39 $8.4B +6.2% Growing 8 Precious Metals & Gems HS 71 $7.9B +17.3% Surging 9 Rice & Agricultural Products HS 10 $6.8B +5.5% Stable 10 Medical Devices & Instruments HS 90 $5.7B +10.2% Fast Growing Thailand’s position as Asia’s largest automotive production hub after Japan and South Korea is clearly reflected in Thailand export statistics — with vehicles and auto parts collectively generating over $31B in annual export revenue. The precious metals surge (HS 71, +17.3%) reflects both gold re-export activity and growing gemstone jewelry exports, a trend also visible in Malaysia export data for the same period. Thailand’s Key Import & Export Partners Thailand’s trade network is anchored by its ties to China and Japan, but the country has diversified significantly through ASEAN integration and FTA expansion. Here is the import source distribution by major trading partner: China26.3% Japan13.8% USA7.2% Malaysia6.1% UAE5.4% Taiwan4.9% South Korea4.3% Others32.0% On the export side, the United States, China, Japan, Australia, and Hong Kong are Thailand’s top five export destinations. Businesses analyzing Indonesia import export data will find that both Indonesia and Thailand compete for similar export markets in electronics and agricultural goods, while simultaneously serving as each other’s regional trade partners within ASEAN frameworks. Thailand’s trade relationship with China is particularly complex: China is Thailand’s largest import source (26.3%) but also one of its key export competitors in ASEAN markets. This dynamic — visible in Thailand bilateral trade data — is reshaping supply chain strategies for multinationals operating across
Indonesia Import Export Data: Trade Statistics, Trends & Market Insights (2026)
Introduction Indonesia export data for imports can be an invaluable source for businesses seeking to expand their operations in Southeast Asia. As one of the most important regions in terms of economic growth, Indonesia plays a key part in international trade. Knowing Indonesia trade statistics can help companies analyse market trends, find the most sought-after products, and make well-informed business decisions. With the growth of international trade Access to reliable Indonesia export import data is vital for importers, exporters as well as market researchers. What exactly is Indonesia Import Export Information? Indonesia export data for imports includes specific records of the goods that are traded within and outside the country. It contains important information like: This information helps companies understand Indonesia data on trade and monitor demand for their products efficiently. Indonesia Trade Overview Indonesia has become a key participant in the global market, and has strong ties to countries such as China, India, Japan and Japan, the United States, and Singapore. Indonesia exports natural resources as well as manufactured goods. It also imports machines and industrial equipment. The analysis of Indonesia trade data enables businesses to comprehend the global trade patterns and pinpoint lucrative opportunities. Major Export products of Indonesia Indonesia is an abundant natural resource and exports a broad range of goods, including: Indonesia export statistics show a an increased demand for these goods in international markets. Large Import Products of Indonesia Indonesia imports many products to help support the growth of its economy and industrialization for example: Indonesia import data assists companies to identify the most sought-after products and identify the most profitable market. Indonesia Import Export Trends Indonesia export trends in the import sector are affected by the global market, policies of the government and the growth of the economy. Important trends include: Understanding these trends will help companies stay at the top of their game on international markets. The benefits of using Indonesia Trade Data Market Research Find the most popular products and new market trends. Find Suppliers and Buyers Find out the importer and exporter’s details to establish connections. Analysis of Competitors Analyze competitor activities and enhance business strategies. Business Expansion Expand your reach globally using data-driven decisions. How businesses use Indonesia Trade Data Businesses use Indonesia import export data to: Exporters, for instance, could use Indonesia export data on imports to know which items are most sought-after and who the main importers are. Access Reliable Indonesia Export Import Information For accurate and up-to-date trading information, companies should be able to rely on reliable platforms. Explore detailed insights here:https://malaysiatradedata.com/ Conclusion Indonesia export data on imports is an effective tool for businesses engaged in international trade. It offers valuable information about export statistics, demand for goods as well as market developments. With this information businesses can spot new opportunities, cut down on risks, and experience long-term growth.
China Import Export Data: Trade Statistics, Trends & Market Insights (2026)
Introduction China’s import-export data is one of the most important resources for businesses involved in global trade. As the world’s largest trading nation, China plays a vital role in international markets. Understanding China’s trade data helps businesses analyze market trends, identify opportunities, and make informed decisions. With increasing competition in global trade, companies require accurate and up-to-date information. Using China’s import-export data, businesses can track product demand, monitor competitors, and find reliable buyers and suppliers. This makes China’s trade data an essential tool for exporters, importers, and market researchers. With increasing competition in global trade, companies require accurate and up-to-date information. What is China’s Import-Export Data? China’s import-export data refers to a detailed record of goods flowing into and out of China. It encompasses various essential details, such as: Product descriptions and HS codesQuantity and shipment volumeImport and export valuesNames of importers and exportersCountry-specific trade data This data helps businesses understand China’s trade statistics and identify which products are in high demand. It is primarily utilized for market research, competitor analysis, and business expansion. Overview of China’s Trade China is the world’s largest exporter and one of the largest importers. The country maintains strong trade relations with the United States, the European Union, India, Japan, and Southeast Asian nations. China’s export statistics reveal that the country exports a wide range of manufactured goods, while importing raw materials and advanced technologies. The balance between imports and exports plays a pivotal role in China’s economic growth. By analyzing China’s trade statistics, businesses can gain insights into global trade patterns and identify new opportunities within international markets. China’s Key Export Products China is renowned for its robust manufacturing sector. Some of its key export products include: Electronics and electrical equipmentMachinery and industrial equipmentTextiles and apparelFurniture and consumer goodsMobile phones and accessories The list of China’s export products underscores the country’s dominance in the manufacturing and technology sectors. Exporters can leverage China’s export data to identify popular products and target the most suitable markets. China’s Key Import Products China imports a diverse array of goods to support its industries and economy. Key import products include: Crude oil and petroleum productsSemiconductors and electronic componentsIron ore and raw materialsAgricultural productsChemicals and industrial inputs The list of China’s import products demonstrates that the country is heavily reliant on imports for raw materials and advanced technology. This creates opportunities for global exporters. China’s Import-Export Trends China’s import-export trends are constantly evolving due to global demand, economic policies, and technological advancements. Recent trends include: Growth in high-tech exportsIncreased demand for energy resourcesExpansion of e-commerce exportsDiversification of trading partners Businesses that analyze China’s import-export trends can stay ahead of the competition and make better strategic decisions. Benefits of Using China’s Trade Data Market Research China’s trade data helps businesses understand market demand and identify profitable products. 🤝 Find Buyers and Suppliers Companies can utilize China’s import-export databases to locate reliable buyers and suppliers. Competitor Analysis Monitoring competitors’ shipments helps businesses refine their own strategies. Business Expansion Accurate information regarding China’s trade enables companies to expand into international markets with confidence. How Businesses Use China’s Import-Export Data Businesses utilize China’s import-export data in various ways to enhance their performance in global trade: Identifying high-demand productsAnalyzing pricing trendsDiscovering new marketsOptimizing supply chain strategiesImproving marketing and sales planning For instance, exporters can use China’s import data for 2026 to understand which products are in demand and which companies are importing them. China Trade Data for Business Growth China’s trade data is indispensable for companies aspiring to expand globally. It provides valuable insights that empower businesses to make data-driven decisions. By utilizing free or paid sources of China’s import-export data, companies can gain detailed trade intelligence and maintain a competitive edge in the global market. This data aids in mitigating risks and enhancing overall operational efficiency. Gain Access to Reliable China Import-Export Data To obtain accurate and up-to-date import-export data from China, businesses should rely on trusted platforms. 👉 View detailed information here:https://malaysiatradedata.com/ This platform offers comprehensive trade intelligence that helps businesses succeed in international markets. Conclusion China’s import-export data serves as a powerful tool for businesses engaged in global trade. It provides detailed insights into trade statistics, product demand, and market trends. By leveraging this data, companies can identify new opportunities, discover reliable partners, and refine their overall business strategies. As global trade continues to expand, utilizing accurate China trade data is becoming increasingly vital.
Malaysia Trade Data for Market Research – Complete Guide 2025
Introduction In today’s business environment that is highly competitive market research plays an essential function in determining the right business choices. Businesses rely on reliable data to comprehend market trends, recognize opportunities and minimize the risk. This is why Malaysia trade Data for Market Research is extremely valuable. Trade data offers detailed insight on the export and import activities aiding businesses to analyze demand, follow competitors and uncover new opportunities on the global market. Companies can make use of Malaysia export data to get real-time information and enhance their decision-making processes. This data is vital for businesses who want to expand their business internationally. What is it? Malaysia Trade Data? Malaysia trade statistics provide details about Malaysia’s export and import activities. The data provides information such as: Businesses can utilize this data to analyze market demand and spot potential opportunities. how Trade Data Helps in Market Research 1. Identifying Market Trends Trade data assists businesses in determining what products are in high demand, and how trends in the market are evolving in the course of time. This helps companies keep ahead of their competitors. 2. Understanding Customer Demand Through the analysis of export and import data companies can learn about their customers’ preferences and then target the correct group of customers. 3. Analyzing Competitors Trade data can provide insights on competitor activities. Companies can determine which items their rivals export and the markets they are looking at. 4. Finding New Opportunities Companies can find opportunities to expand their operations globally by studying trading patterns as well as identifying demand-driven regions. The Benefits of Using Malaysia Trade Data to conduct Market Research Making use of Malaysia trade Data for Market Research has several benefits: Companies that utilize trade data efficiently can get an edge on the global market. How Businesses can Use trade Data Effectively To maximize the value of data on trade, companies must follow these guidelines: Through these methods firms can improve their market research and get more effective outcomes. Current Trends for Market Research Utilizing Trade Data Market research is constantly evolving due to technological advancements. The most important trends are: These trends emphasize the growing significance of data on trade in contemporary business settings. Conclusion Knowing Malaysia Trade Data for Market Research is vital for companies that want to be successful on the international market. Through the analysis of trade data, companies are able to discern trends, comprehend the market, and make educated choices. Trade data doesn’t just aid in market research, but it also helps companies to grow and stay competitive. For more insights, visit: https://malaysiatradedata.com/Malaysia import data :- https://malaysiatradedata.com/malaysia-import-data/Malaysia trade statistics :- https://www.trade.gov/country-commercial-guides/malaysia-market-overview
How to Use Trade Data to Grow Your Export Business

How to Use Trade Data to Grow Your Export Business 0 Countries generating customs shipment records 0 % of exporters cite market discovery as top challenge 4x Faster buyer verification vs. traditional research #1 Malaysia ranked top 3 ASEAN trade hub by volume Expanding your export business has never been more data-rich — or more confusing. Between conflicting market reports, unreliable supplier directories, and expensive trade consultants, many exporters still make critical decisions based on incomplete information. The solution is simpler than most realize: trade data. Real, customs-sourced shipment records that tell you exactly what is moving, where it’s going, who is buying it, and at what volumes. This guide shows you how to use it strategically — from discovering untapped markets to closing deals with verified buyers. Why Trade Data Is Your Biggest Competitive Edge Most exporters rely on government reports, trade association surveys, or word-of-mouth to understand overseas markets. These sources share one critical flaw: they describe what happened in broad strokes, months after the fact. Trade data, by contrast, comes from customs filings — real transactions at real ports, in real time. Every shipment crossing an international border generates a record: the exporter’s name, the importer’s name, product description, HS code, quantity, declared value, port of loading, and port of discharge. Aggregated and cleaned, this becomes an extraordinarily precise map of global commerce. “Trade data doesn’t tell you what might happen in a market. It tells you what is already happening — who is already buying your product, from whom, at what price, and how often.” For export data specifically, this means you can identify which countries are actively importing your product category, spot which markets are growing fastest, and see exactly who your competitors are shipping to — before you spend a single dollar on market entry. What Exactly Does Trade Data Show You? When you access a trade data platform for a product — say, electrical components or processed food — here is the level of detail you typically get: Data Field What It Tells You Strategic Value Importer name & address Who is actively buying your product category High Exporter name & country Who your competitors are and where they’re based High HS code Exact product classification for precise filtering High Shipment quantity & value Market sizing and buyer purchasing power Medium–High Frequency & dates Buying cycles and seasonal demand patterns Medium–High Port of entry/exit Logistics planning and preferred trade routes Medium Combined, these fields let you construct a full picture of any target market — who the active buyers are, what volumes they purchase, when they reorder, and which suppliers currently hold their business. Three Core Strategies to Grow Exports with Trade Data 1. Discover New Export Markets Before Competitors Do The most common mistake exporters make is chasing the same obvious markets as everyone else. Trade data lets you find emerging demand pockets — countries where imports of your product are rising sharply, but competition from other exporters is still thin. By analyzing import data flows into Southeast Asia, you might discover that a mid-tier market is increasing purchases of your product by 40% year-over-year while being served by only two or three exporters globally. That is an entry window most traditional market research would never surface. 📍 Market sizing Measure total import volumes by country and identify which markets have real, sustained demand for your product category. 📈 Growth trending Track month-over-month import growth per country to spot markets gaining momentum before they become crowded. 🏁 Competitive density Count active exporters serving each market — fewer competitors means greater room to win market share. 🔄 Supplier switching signals Identify buyers who recently changed their supplier — they are actively open to new relationships. 2. Build a Verified Buyer Pipeline — Not a Cold Lead List Traditional prospecting produces contacts. Trade data produces verified buyers: companies with a proven history of purchasing your exact product category, at real volumes, on a recurring basis. 🔗 Related Guide Find Buyers Using Malaysia Trade Data A step-by-step breakdown of how to identify, qualify, and reach active buyers in the Malaysian market using real shipment intelligence. When you contact a buyer using trade data, you already know their order volume, their current supplier, and their reorder timing — transforming cold outreach into a warm, evidence-based conversation. They have actively purchased your product category — this is not a speculative lead Their approximate order volume and frequency, so you can pitch the right package size Which supplier they currently use, allowing you to position directly against a known competitor When their last shipment arrived, giving you a natural outreach window before their next reorder cycle Reaching out to a buyer with shipment-level knowledge of their purchasing behavior transforms cold outreach into a warm conversation. You’re not selling — you’re solving a need you can already prove they have. 3. Benchmark Pricing and Win on Value — Not Just Price Because customs records include declared shipment values alongside quantities, you can calculate approximate per-unit pricing for competing exporters in any market. This means you know whether your competitors are winning on price, volume discounts, or premium positioning. Combined with export data analytics, this creates a pricing strategy grounded in market reality rather than internal assumptions. Practical tip: Filter trade data by your HS code + destination country, then sort by declared value ÷ quantity. This gives you a market-level price range, helping you position your offer competitively without undercutting unnecessarily. Your 6-Step Export Growth Action Plan Identify your HS code. Every trade data query starts here. The correct 6–8 digit HS code for your product ensures results are precise, not approximate. Incorrect codes are the single biggest source of bad data. Run a market opportunity scan. Search import data by HS code across multiple countries. Rank markets by total import volume and year-on-year growth rate. Shortlist 3–5 high-potential targets. Map active buyers in each target market. Filter by destination country to extract verified importers who have actually
How to Find Buyers Using Malaysia Trade Data (Complete Guide 2025)
Introduction In the current globalized market finding trustworthy buyers is among the most difficult tasks for companies. If you’re an exporter or a manufacturer, finding the right buyers can have a significant impact on the growth of your company. This is why Finding Buyers using Malaysia Trade Data can be a successful strategy. Trade data can provide valuable insight into records of shipping along with buyer details and demand for products. Companies can utilize this information to reach out to potential buyers and grow internationally. What is it? Malaysia Trade Data? Malaysia trade data contains specific information on import and export operations. It gives insights on: Businesses can research Malaysia export data to determine potential buyers and assess the demand for their products effectively. How to Find Buyers Malaysia Data on Trade Data 1. Find products that are in high demand Begin by looking at which items are being exported or imported often. Demand-driven products suggest an abundance of market opportunities as well as potential buyers. 2. Examine Shipment Records The data on shipping helps companies track who is purchasing what. It can help identify businesses who regularly import specific items and target them as potential buyers. 3. Target Specific Countries Concentrate on countries that have significant trade relations with Malaysia. These markets typically have higher need of Malaysian products. 4. Contact Information of Buyer Trade data usually contains company names and other information about the company. Businesses may use this data to directly contact potential buyers. 5. Study Competitor Information Review the exports of your competitors to determine their customers. This will help you find similar companies and grow your client base. Benefits of Utilizing Trade Data to Locate Buyers Utilizing trade data provides a variety of benefits: Companies that utilize trade data can lower risks and increase their odds of success in international trade. Best Practices for Identifying Buyers Conclusion Knowing how to find buyers using Malaysia trade Data can change the direction of your business. By studying the data of shipment records and identifying the most popular products and targeting the appropriate markets, businesses are able to connect with trustworthy buyers and expand internationally. For more insights, visit: https://malaysiatradedata.com/Malaysia trade statistics : https://www.trade.gov/country-commercial-guides/malaysia-market-overviewMalaysia import data: https://malaysiatradedata.com/malaysia-import-data/
What is HS Code? Complete Guide for Importers and Exporters

Introduction The business of international trade is a massive one, with thousands of goods being traded every day across the globe. For the smooth conduct of this trade, a system of classification has been adopted, and this is called theHS Code. Whether you are an exporter, importer, or a customs agent, it is vital to understand the importance of the HS Code while conducting your international trade business across the globe.In this article, we will be discussing what an HS Code is, how it works, the importance of the HS Code, and how it is used for export-import trade in Malaysia. What is an HS Code? An HS Code, short for Harmonized System Code, is a standardized international classification system of products being traded internationally. Designed and implemented by the World Customs Organization (WCO), this code ensures all items traded internationally have identical codes worldwide. All imported or exported products, whether imported or exported, are assigned an identification code in order for customs officials to identify it and apply taxes and regulations accordingly. Example of products and their codes: All products sold internationally carry their own HS code, making this international trade documentation system the backbone of international commerce. Over 200 countries currently utilise it. Structure of HS Code An HS Code usually consists of 6 digits, which can be extended by individual countries for more detailed classification. Standard Structure Digits Description Example First 2 Digits Product Chapter 84 Next 2 Digits Heading 71 Last 2 Digits Subheading 30 Example HS Code Breakdown HS Code Meaning 84 Machinery and mechanical appliances 8471 Automatic data processing machines 8471.30 Portable computers (laptops) Many countries extend this code to 8 or 10 digits to create more detailed classifications. HS Code in Malaysia In terms of HS code Malaysia, it is under the administration of the Royal Malaysian Customs Department. In Malaysia, an extended version of HS is used, which is known as ASEAN Harmonized Tariff Nomenclature, abbreviated as AHTN. This system is important in regulating the import export Malaysia activities, ensuring that all goods traded fall under the right classification. In Malaysia, HS code is usually extended to 10 digits for accurate identification. Purpose Explanation Import Duties Determines tax rates on imported goods Sales Tax Helps calculate applicable taxes Trade Regulations Ensures compliance with trade laws Customs Clearance Helps identify products quickly Trade Statistics Tracks national import and export data Businesses involved in import export Malaysia must use the correct HS code when submitting customs declarations. Why HS Codes are Important in International Trade HS codes play a pivotal role in global trade. Without their classification system, customs processes would quickly become unruly and ineffective. Here are some major reasons for their significance: Benefit Description Customs Identification Helps customs identify products Duty Calculation Determines applicable tariffs Trade Data Analysis Used to track global trade Compliance Ensures adherence to regulations Logistics Efficiency Reduces customs delays How HS Codes Help Importers and Exporters HS codes have several advantages for businesses that conduct trade. Market Research By studying the market based on HS code trade, businesses can gain information on: This is particularly beneficial for businesses that conduct import export Malaysia, aiming to take their business to the global market. Finding Buyers and Suppliers Some businesses also use the trade database to search for importers and exporters based on the HS code. This helps businesses find their buyers and suppliers. Competitor Analysis Trade information based on the HS code also helps businesses track their competitors. Examples of Common HS Codes Here are some examples of commonly used HS codes in global trade: Product HS Code Mobile Phones 8517 Laptops 8471 Plastic Products 3926 Rubber Products 4016 Automotive Parts 8708 These codes help customs officials identify the exact type of product being traded. Ways to Find the Right HS Code It is always important for a business to ensure that the right HS code is being utilized in order to avoid any issues with customs. ways in which a business may find the right HS code for their product. 1. Customs Tariff Websites All countries provide their customs tariff websites from which the business may search for the HS code. 2. Trade Data Platforms There are many global trade intelligence platforms that provide the business with the option of searching for the HS code for their product, in addition to trade data. 3. Freight Forwarders and Customs Brokers Freight forwarders and custom brokers may be of assistance to the business in searching for the right HS code for their product. Common Mistakes Businesses Make with HS Codes Many importers and exporters make mistakes when assigning HS codes. Some common errors include: Mistake Impact Using wrong classification Incorrect duties Using outdated HS codes Customs rejection Copying competitor codes Product mismatch Ignoring country extensions Compliance issues Incorrect HS codes can lead to: Therefore, businesses involved in import export Malaysia must ensure that they use accurate HS codes. How Trade Data Uses HS Codes HS codes form the cornerstone of global trade data analysis. Each shipment recorded with customs databases is classified using these codes. Trade Data Insights: Insight Type Information Provided Importers List Buyers importing specific products Exporters Database Suppliers exporting goods Shipment Records Detailed shipment history Product Demand Market demand analysis Trade Trends Global trade patterns Businesses can analyze this data to identify potential markets and expand their international presence. Conclusion The HS Code system is one of the most important tools used in international trade. It provides a standardized way to classify products, calculate duties, and regulate cross-border shipments. For businesses that are part of the import export Malaysia industry, it is essential to know about the HS code in Malaysia. By using the right HS codes, businesses in the import and export Malaysia industry can stay out of trouble and get valuable insights about the international trade markets. As the international trade industry continues to flourish, the HS code system will remain one of the most important tools used in the industry, helping businesses around the world connect with each other. Malaysia Export Data: Top Products, Buyers & Market Trends (2026 Guide)
How Import Export Trade Data Helps Businesses Find Global Buyers
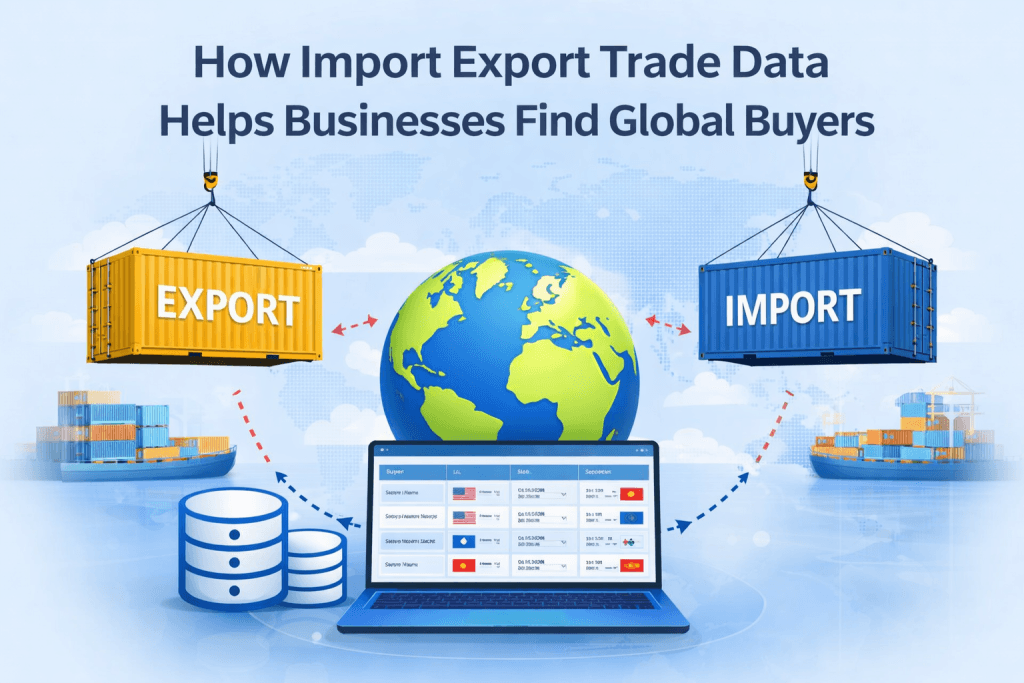
In the present competitive global marketplace companies require accurate data to make better trade choices. Trade data on imports and exports has become one of the most useful sources for companies seeking to expand internationally and find new buyers. Trade data offers detailed insight into the global shipping activities aiding businesses to understand what goods are being exported and imported across various nations. Understanding Import Export Trade Data Export trade data for imports includes specific details about shipment levels like description of the product and HSC codes suppliers and buyers details, quantity of the shipment and the countries of the country of. This data helps businesses track the international trade movement and spot markets with potential. Companies can make use of this information to study demand patterns and determine which countries are trading certain products. Locating Genuine Buyers and Suppliers One of the most significant benefits of trade records is their capability to determine the authentic consumers and their suppliers. Instead of relying on directories that are random companies can consult shipping records to find out the companies that are currently trading or importing certain products. Exporters can identify buyers who are verified and establish stronger international relationships. Analyzing Competitors Made Simple Export shipment information from imports also assists businesses in monitoring their competition. By studying competitor shipments and data, businesses can discover: This knowledge allows companies to improve their strategies and remain ahead of the competition in the global market. Finding new Market Opportunities Trade data provides valuable insights into emerging markets. Companies can pinpoint areas where the demand for certain goods is growing and then plan their expansion accordingly. For instance, if product’s imports are increasing in a particular region, exporters may concentrate on the market with more confidence. Why Businesses Need Reliable Trade Intelligence The reliable trade data can help companies reduce risk and make informed decisions. With precise import export information companies can spot lucrative opportunities, boost the supply chain management process, and improve their strategies for international trade. Conclusion Export trade data from imports can be a valuable tool for businesses looking to expand their business in international markets. By studying shipment information as well as market patterns, businesses can determine buyers, keep track of competitors and identify new opportunities for trade. By utilizing the correct trade data companies can make better decisions and grow sustainably within international commerce.