
Vietnam Electrical Machinery Import Data 2025 – HS Code 85
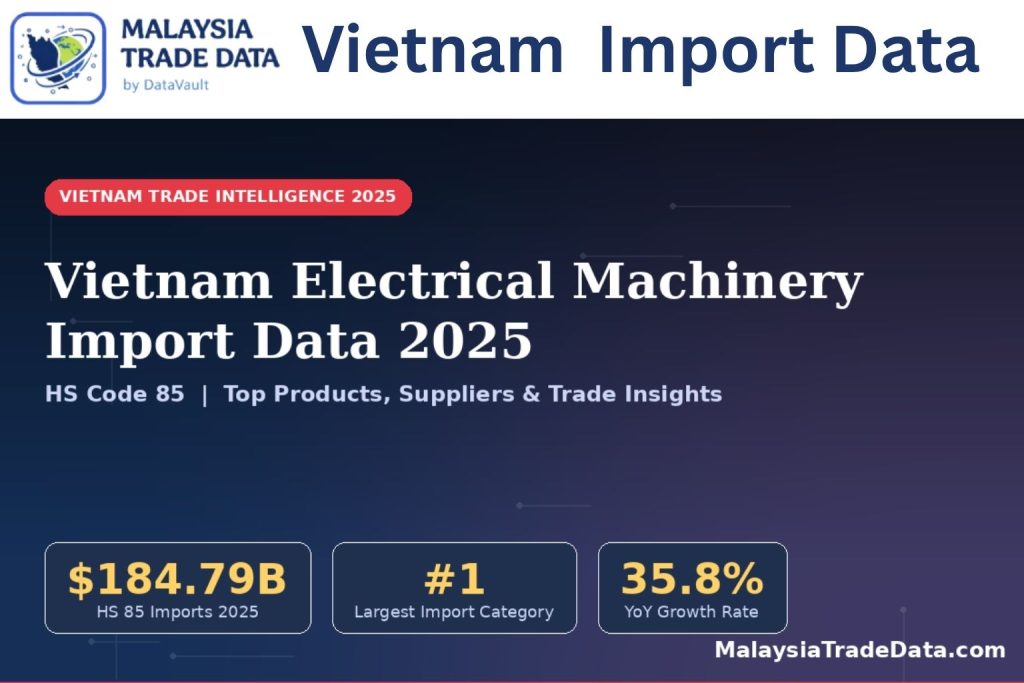
Vietnam Electrical Machinery Import Data 2025 – HS Code 85 | Top Products, Suppliers & Trade Insights 🔥 Vietnam Electrical Machinery Imports Hit $184.79 Billion in 2025 — HS Code 85 Leads All Categories Vietnam Trade Intelligence 2025 Vietnam Electrical Machinery Import Data 2025 – HS Code 85 | Top Products, Suppliers & Trade Insights Published: July 2, 2025 | By MalaysiaTradeData Research Team | 12 min read $184.79B HS 85 Imports 2025 #1 Largest Import Category 35.8% YoY Growth Rate 50+ Source Countries Home › Blog › Vietnam Electrical Machinery Import Data 2025 – HS Code 85 Vietnam’s electrical machinery and equipment sector (HS Code 85) has emerged as the largest import category, accounting for over $184 billion in 2025. This comprehensive guide covers Vietnam’s top HS 85 sub-products, major supplier countries, year-on-year import trends, and key trade insights for businesses, importers, and market researchers. Vietnam Electrical Machinery Import Market Overview 2025 Vietnam has rapidly established itself as one of Southeast Asia’s most electronics-intensive manufacturing economies. The country’s dependence on imported electrical components — particularly integrated circuits, semiconductor devices, and telecom equipment — reflects its role as a global assembly hub for smartphones, laptops, and consumer electronics. According to the latest Vietnam trade data, HS Chapter 85 accounted for 41.2% of total import value in 2025, making it by far the single largest import chapter. The surge is driven by massive FDI from Samsung, Intel, LG, and other global electronics giants who set up manufacturing operations in Vietnam’s industrial zones. 🇻🇳 Vietnam HS Code 85 Import Key Statistics — 2025 Metric Value (2025) Change vs 2024 Total HS 85 Import Value $184.79 Billion ▲ 35.8% Share in Total Vietnam Imports 41.2% ▲ 5.3 pts Total Import Shipments (HS 85) 4.2 Million Shipments ▲ 28.4% Top Supplier Country (2024) China 43.1% share Top Sub-Product (4-digit) HS 8542 – Integrated Circuits ▲ 41.2% Top Importing Port Ho Chi Minh City 48.6% of volume Source: MalaysiaTradeData.com Research Vietnam HS 85 Import Value — Last 10 Years Trend Vietnam’s electrical machinery imports have grown at a compound annual growth rate (CAGR) of 16.2% over the past decade. The steep acceleration from 2020 onwards reflects Vietnam’s rise as the world’s preferred China+1 manufacturing destination. 📊 Vietnam Electrical Machinery (HS 85) Import Value — 2016 to 2025 (USD Billion) 2016$47.73B 2017$63.78B 2018$67.90B 2019$77.77B 2020$95.44B 2021$118.14B 2022$122.72B 2023$112.72B 2024$136.04B 2025$184.79B ★ Source: MalaysiaTradeData Research 2025 Year HS 85 Import Value (USD) YoY Growth 2016 $47.73 Billion — 2017 $63.78 Billion ▲ 33.6% 2018 $67.90 Billion ▲ 6.5% 2019 $77.77 Billion ▲ 14.5% 2020 $95.44 Billion ▲ 22.7% 2021 $118.14 Billion ▲ 23.8% 2022 $122.72 Billion ▲ 3.9% 2023 $112.72 Billion ▼ 8.2% 2024 $136.04 Billion ▲ 20.7% 2025 $184.79 Billion ▲ 35.8% Top 10 Electrical Machinery Products Vietnam Imported in 2025 (HS Code 85) Under HS Chapter 85, Vietnam imports a wide range of sub-products from integrated circuits to transformers. Here are the top 10 by import value: 🏆 TOP 10 ELECTRICAL MACHINERY IMPORTS — VIETNAM 2025 (HS Code 85) 1 Integrated Circuits & Microassemblies HS Code: 8542 $72.4 Billion 2 Telephones & Smartphone Parts HS Code: 8517 $34.8 Billion 3 Electronic Components & Printed Circuits HS Code: 8534 / 8536 $18.6 Billion 4 Electric Motors & Generators HS Code: 8501 $12.3 Billion 5 Transformers & Static Converters HS Code: 8504 $9.7 Billion 6 Display Panels (LCD/OLED) HS Code: 8524 $8.9 Billion 7 Batteries & Accumulators HS Code: 8507 $7.2 Billion 8 Sound Recording Apparatus HS Code: 8519 / 8521 $6.4 Billion 9 Electrical Switches & Connectors HS Code: 8536 / 8544 $5.8 Billion 10 Lighting Equipment & LEDs HS Code: 8539 / 8543 $4.2 Billion Source: MalaysiaTradeData.com Analysis 2025 1. Integrated Circuits (HS 8542) — $72.4 Billion Integrated circuits are Vietnam’s single largest import item under HS 85, driven by Samsung’s massive semiconductor assembly operations in Thai Nguyen and Bac Ninh provinces. Vietnam imported $72.4 billion worth of ICs in 2025, a jump of 41.2% compared to 2024, as global chip demand rebounded strongly. South Korea, China, and Taiwan are the dominant suppliers of ICs into Vietnam. 2. Telephones & Smartphone Parts (HS 8517) — $34.8 Billion Vietnam is the world’s second-largest smartphone exporter, but it also imports massive quantities of phone components for final assembly. HS 8517 covers smartphones, telephone sets, and their parts. The bulk of these imports arrive from China and South Korea, feeding the Samsung and Apple supply chains operating in northern Vietnam. 3. Electronic Components & PCBs (HS 8534/8536) — $18.6 Billion Printed circuit boards (PCBs) and electronic components form the backbone of Vietnam’s electronics export industry. Vietnam imported $18.6 billion worth of PCBs and components in 2025, predominantly from China, Japan, and Taiwan. These are used in consumer electronics, industrial equipment, and automotive electronics assembled domestically. Vietnam HS 85 Imports by Source Country — 2024 China remains Vietnam’s dominant supplier of electrical machinery, but South Korea, Taiwan, and Japan also hold significant shares thanks to major FDI relationships. 🌍 Vietnam Electrical Machinery (HS 85) — Top Supplier Countries 2024 🇨🇳 China $58.63B 43.1% 🇰🇷 South Korea $34.93B 25.7% 🇹🇼 Taiwan $14.18B 10.4% 🇯🇵 Japan $7.96B 5.9% 🇺🇸 USA $4.54B 3.3% 🌐 Others $15.81B 11.6% Source: MalaysiaTradeData.com 2025 Major Companies Importing HS 85 Products in Vietnam Vietnam’s HS 85 import landscape is dominated by multinational electronics giants. Key importers as per verified Vietnam trade data include: # Company Name Products Imported Country of Origin 1 Samsung Vietnam Integrated Circuits, Phone Parts South Korea, China 2 Intel Products Vietnam Semiconductor Components USA, Malaysia 3 LG Electronics Vietnam Display Panels, Components South Korea 4 Foxconn Vietnam PCBs, Electronic Parts China, Taiwan 5 Panasonic Vietnam Motors, Transformers Japan 6 Canon Vietnam Optical & Electronic Equipment Japan, China 📖 Also Read: Vietnam Export Data 2026 – Trade Statistics & Top Products Malaysia Electronics Import Data 2026 | HS Code 8542 Guide Vietnam Trade Data – Complete Import Export Intelligence 2025 Why Vietnam’s HS 85 Imports Are Growing So Fast 1. FDI-Driven Electronics Manufacturing
Indonesia Import Data: How to Find Verified Buyers in 2026
The importance of Indonesia import data has significantly increased because it has become the best way for entrepreneurs to enter the Southeast Asian market. Being one of the world’s fastest growing countries, Indonesia is full of potential in industries such as electronics, machinery, agriculture, and others. When it comes to doing business in 2026, competition in global trade increases rapidly. Enterprises and organizations that use old ways of prospecting face a lot of problems, including poor quality of leads and contact data. That’s when Indonesia import data become an indispensable element of success. What is Indonesia Import Data? Indonesia import data means statistical reports on goods imported into Indonesia from other nations. These details include: • Importer name • Exporter name • Description of product • H.S. Code Classification • Number of goods and their cost • Port of Import • Country of Origin These details have been derived from custom data and serve as a reflection of international business transactions. Importers’ data for exporters serves as a database of buyers for their products. Why Businesses Need Indonesia Import Data 1. Locate Confirmed Buyers 2. Learn about Market Demand This helps in selecting the right products for export. 3. Competitor Analysis The import data shows: • The suppliers used by competitors • Trends in pricing • The positioning of the competitors in the market This enables organizations to tweak their approach and remain competitive. ________________________________________ 4. Risk Reduction Trading with new contacts involves risks. However, import data reduces these risks through information on: • Company names • Trading history • Behavior patterns ________________________________________ 5. Increase Sales Conversion Rate Rather than contacting companies cold, organizations can go for companies that already purchase similar products. How to Identify Verified Buyers Using Indonesia Import Data Finding buyers is easy. Finding verified buyers is the real challenge. Here’s how import data helps: 🔍 Step 1: Filter by Product (HS Code) Start by selecting the correct HS code related to your product. This ensures you are targeting the right market segment. 🔍 Step 2: Identify Active Importers Look for companies that: These are high-potential buyers. 🔍 Step 3: Analyze Shipment Frequency Frequent importers indicate: 🔍 Step 4: Check Supplier Relationships If a buyer is importing from a specific country, you can position yourself as an alternative supplier with better pricing or quality. 🔍 Step 5: Shortlist and Contact Create a list of verified buyers and approach them with: Key HS Codes in Indonesia Import Data HS codes play a critical role in identifying products and tracking trade activity. Some important HS code categories in Indonesia include: Electronics (HS Code 85) Machinery (HS Code 84) Chemicals (HS Code 29 & 38) Agriculture Products (HS Code 10 & 12) Automotive (HS Code 87) By targeting the right HS codes, businesses can focus on specific industries and find relevant buyers. Indonesia Import Trends in 2026 Indonesia’s import sector continues to grow due to: Key Trends: These trends create significant opportunities for exporters worldwide. Challenges Without Import Data Businesses that do not use import data often face: This leads to wasted time and resources. How Data Vault Insights Helps Data Vault Insights provides advanced trade intelligence solutions to help businesses succeed in global markets. Key Benefits: With Data Vault Insights, businesses can: 👉 Explore detailed Indonesia import data here:https://malaysiatradedata.com/ Best Practices for Using Import Data To maximize results: Conclusion Indonesia import data is no longer optional—it is essential for businesses aiming to grow in international markets. In 2026, companies that leverage trade data will have a clear advantage in identifying verified buyers, understanding market demand, and increasing sales efficiency. By using the right data tools and strategies, businesses can unlock new opportunities and build long-term global partnerships.
Malaysia Electronics Import Data 2026 | HS Code 8542 Guide
Home › Blog › Malaysia Import Data › Malaysia Electronics Import Data 2026 Malaysia Trade Intelligence 2026 Malaysia Electronics Import Data 2026: HS Code 8542 Guide, Top Suppliers & Trade Insights Malaysia is ASEAN’s largest electronics importer and a critical node in the global semiconductor supply chain. This comprehensive guide covers Malaysia electronics import data for 2026 — including HS code 8542 breakdowns, top supplier countries, shipment statistics, duty rates, and how to find verified Malaysian electronics importers. Updated: April 2026 13 min read Malaysia Electronics Data $62.1BMalaysia Electronics Imports 2025 #1ASEAN Electronics Importer HS 8542Largest Single Import HS Code 0%ITA Duty on Most Electronics MT Malaysia Trade Data Research Team — Data Vault Trade Intelligence Analysts · Published April 23, 2026 · 13 min read Malaysia’s electronics import sector is the largest in ASEAN — and for good reason. As home to Intel, Western Digital, Infineon, Texas Instruments, and dozens of other major semiconductor manufacturers, Malaysia imports an extraordinary volume of electronic components, wafers, equipment, and sub-assemblies that feed its world-class electronics export machine. Malaysia electronics import data for 2026 reveals a $62.1 billion market dominated by integrated circuits, semiconductor components, and high-value manufacturing inputs. For trade professionals, exporters targeting Malaysian buyers, and market researchers analyzing ASEAN electronics flows, understanding Malaysia electronics import data by HS code — particularly HS 8542 (integrated circuits) — provides the granular intelligence needed for sourcing strategy, competitive positioning, and market entry decisions. This guide from MalaysiaTradeData.com delivers the most comprehensive analysis available. Malaysia Electronics Import Overview 2026 Electronics — classified primarily under HS Chapter 85 — account for approximately 27% of Malaysia’s total merchandise import value, making it the single largest import category by a significant margin. This dominance reflects Malaysia’s unique position as both a major electronics manufacturer and a significant consumer of electronic goods. The country’s free trade zones (FTZs), particularly in Penang, Selangor, and Johor, operate as global manufacturing hubs that import billions in components for value-added processing and re-export. Key Insight: Malaysia’s electronics import structure is fundamentally different from most ASEAN neighbors. Approximately 75% of electronics imports are intermediate goods — semiconductor wafers, ICs, PCBs, and components — imported by multinational manufacturers for processing and re-export. Only 25% are final consumer or capital goods for domestic use. This processing-trade structure means HS 8542 (integrated circuits) is by far Malaysia’s most-imported single HS code, with value exceeding $28B annually — more than any other ASEAN country imports in this category. Businesses comparing electronics import patterns across ASEAN — including those tracking Vietnam import data for electronics — will find Malaysia and Vietnam occupy similar roles as electronics processing hubs, but Malaysia’s semiconductor specialization gives it a higher average import value per shipment. Companies monitoring Philippines import data will note that Philippines imports Malaysian-processed electronics as finished goods — making Malaysia both a regional production base and a supplier to neighboring ASEAN markets. HS Code 8542: Malaysia’s Most Critical Electronics Import HS Code 8542 (Electronic Integrated Circuits) is the single most important HS code in Malaysia’s entire import registry — not just electronics. Here is a complete breakdown of HS 8542 and its sub-classifications as they appear in Malaysia electronics import data 2026: HS Code Product Description Import Value (2025) Top Source Countries Duty Rate Growth 8542.31 Processors & Controllers (CPUs, MCUs) $14.8B Taiwan, USA, South Korea 0% ITA +12.4% 8542.32 Memory ICs (DRAM, NAND Flash, SRAM) $8.6B South Korea, USA, Japan 0% ITA +15.8% 8542.33 Amplifiers (RF, Audio, Operational Amps) $2.1B USA, Japan, Germany 0% ITA +6.2% 8542.39 Other Electronic ICs (ASICs, FPGAs, DSPs) $3.4B Taiwan, USA, Netherlands 0% ITA +18.6% Why HS 8542.39 (ASICs/FPGAs) is the fastest growing (+18.6%): Application-Specific Integrated Circuits and Field-Programmable Gate Arrays are the backbone of AI accelerators, 5G base stations, and data center computing — all sectors experiencing explosive growth. Malaysia’s semiconductor packaging and test facilities receive massive volumes of these advanced chips from TSMC (Taiwan) and Intel (USA) for final packaging, testing, and distribution. Exporters targeting this segment should monitor Malaysia HS 8542 import data to identify which packaging companies are the active buyers. Top Electronics HS Codes in Malaysia Import Data 2026 Beyond HS 8542, Malaysia’s electronics import universe spans dozens of critical HS codes. Here is the complete picture of Malaysia electronics import HS codes ranked by value: HS Code Product Import Value Top Supplier MFN Duty Trend 8542.XX Electronic Integrated Circuits (All) $28.9B Taiwan, South Korea, USA 0% +13.8% 8541.10 Diodes, Transistors & Semiconductor Devices $8.4B Japan, Taiwan, Germany 0% +7.2% 8517.62 Base Stations, Routers & Telecom Machines $5.8B China, Finland, Sweden 0–5% +11.4% 8471.30 Laptops & Portable Computers $4.6B China, Taiwan, Japan 0% +8.1% 8534.00 Printed Circuit Boards (PCBs) $4.2B China, Japan, South Korea 0% +6.8% 8544.42 Electric Conductors with Connectors ≤1000V $3.6B China, Japan, Taiwan 0–5% +5.4% 8507.60 Lithium-Ion Battery Cells & Packs $2.8B China, South Korea, Japan 0% +24.6% 8541.40 Photovoltaic Solar Panels $2.4B China, Taiwan, USA 0% +31.2% 8536.90 Electrical Switching/Protection Apparatus $1.9B Japan, Germany, China 0–5% +6.1% 9018.90 Medical Electronic Instruments $1.6B USA, Germany, Japan 0% +10.8% Top Supplier Countries for Malaysia Electronics Imports Malaysia sources its electronics imports from a highly concentrated set of partners, with East Asian technology economies dominating. Here is the supplier country share from Malaysia electronics import statistics 2026: Taiwan26.2% China21.8% South Korea14.3% Japan10.1% USA8.4% Netherlands4.2% Singapore3.8% Others11.2% Taiwan’s 26.2% dominance reflects TSMC’s position as Malaysia’s primary IC foundry supplier — wafers and chips fabricated at TSMC’s fabs in Hsinchu and Tainan are shipped to Malaysian assembly and test facilities for packaging, final test, and distribution. Netherlands at 4.2% is disproportionately significant — almost entirely driven by ASML, whose EUV lithography machines (classified under HS 8486) are essential for semiconductor manufacturing and command some of the highest unit values of any import into Malaysia. For businesses analyzing how Malaysia’s electronics supply chain interconnects with other ASEAN economies, cross-referencing with Thailand import export data shows that Thailand sources significant electronics components from Malaysia — confirming Malaysia’s role as a regional
Philippines Import Data by HS Code – Complete Guide for Businesses
Philippines Import Data by HS Code 2026: Complete Guide to HS Code Search & Trade Intelligence Home › Trade Data › Philippines Import Data › Philippines Import Data by HS Code HS Code Intelligence 2026 Philippines Import Data by HS Code: Complete Search Guide & Trade Statistics The most comprehensive guide to searching Philippines import data by HS code — covering top imported HS chapters, shipment volumes, duty rates, importer records, and how to leverage HS code intelligence for sourcing, compliance, and market research in 2026. Updated: April 2026 14 min read Philippines HS Code Data Quick Philippines HS Code Lookup Enter an HS code or product keyword to find import data details, duty rates, and top source countries for the Philippines. Search HS Code 5,000+Active HS Codes in PH Imports $145B+Total Import Value 2025 HS 85Largest Import HS Chapter 99Total HS Chapters Tracked MT Malaysia Trade Data Research Team Trade Intelligence Analysts · Published April 17, 2026 · 14 min read When businesses and trade professionals search for Philippines import data by HS code, they are looking for one of the most powerful forms of trade intelligence available: shipment-level records organized by the internationally standardized Harmonized System (HS) classification. Every product crossing into the Philippines through any port of entry is assigned an HS code by the Bureau of Customs (BOC), and this classification determines tariff rates, import licensing requirements, statistical reporting, and trade partner analysis. This guide delivers a complete breakdown of how Philippines HS code import data works, which HS chapters dominate Philippine import flows, how to search and interpret HS code records, and how businesses can use this intelligence for procurement, market entry, compliance, and competitive analysis in 2026. What Is HS Code Import Data for the Philippines? The Harmonized System (HS) is a globally standardized nomenclature developed by the World Customs Organization (WCO) and used by 200+ countries to classify traded goods. The Philippines adopts the ASEAN Harmonized Tariff Nomenclature (AHTN) — a regional extension of the HS — which aligns with the 6-digit international HS code at the chapter, heading, and subheading level, with additional national digits for local tariff line specificity. How HS Codes Work: A Philippines HS code like 8542.31.10 breaks down as follows — Chapter 85 (Electrical machinery), Heading 8542 (Electronic integrated circuits), Subheading 8542.31 (Processors and controllers), National tariff line .10 (specific Philippine classification). Each level unlocks progressively more specific import data, duty rates, and regulatory requirements. When you search Philippines import data by HS code, you are drilling into these layers to find real shipment records. For businesses tracking regional trade patterns — including those already analyzing Malaysia import data or studying Vietnam import data — the HS code provides a universal language for comparing trade flows across countries. The same HS 8542.31 code that describes semiconductor imports into the Philippines is used identically in Thailand, Vietnam, Malaysia, and every other country in the world. Top HS Chapters in Philippines Import Data 2026 Understanding which HS chapters drive the largest import volumes in the Philippines gives exporters, analysts, and logistics professionals an immediate picture of where market demand is concentrated. Here are the top HS chapters by import value in the Philippines for 2025–2026: HS Chapter 85 $28.6B Electrical Machinery, Electronics & Components Top SourceJapan, South Korea, China Key ProductsICs, semiconductors, phones MFN Duty Rate0–15% +10.4% YoY HS Chapter 27 $22.4B Mineral Fuels, Oils & Petroleum Products Top SourceSaudi Arabia, UAE, South Korea Key ProductsCrude oil, diesel, LNG, coal MFN Duty Rate0–3% +3.8% YoY HS Chapter 84 $16.8B Machinery, Mechanical Appliances & Equipment Top SourceJapan, China, Germany Key ProductsTurbines, pumps, computers, CNC MFN Duty Rate0–10% +8.9% YoY HS Chapter 87 $9.4B Vehicles, Cars & Automotive Parts Top SourceJapan, South Korea, China Key ProductsPassenger cars, trucks, auto parts MFN Duty Rate5–30% +12.6% YoY HS Chapter 72–73 $8.7B Iron, Steel & Articles of Iron or Steel Top SourceChina, Japan, South Korea Key ProductsFlat steel, rebar, pipes, structures MFN Duty Rate3–15% +5.3% YoY HS Chapter 10 $3.2B Cereals — Rice, Wheat & Grains Top SourceVietnam, Thailand, India Key ProductsMilled rice, wheat, corn MFN Duty Rate35–50% +6.1% YoY Philippines Import Data: Detailed HS Code Breakdown Beyond chapter-level analysis, Philippines import data by HS code becomes most actionable at the 6-digit and 8-digit subheading level. Here is a detailed breakdown of the most searched and highest-volume HS codes in Philippine customs import records for 2026: HS Code Product Description Import Value (2025) Top 3 Source Countries MFN Duty Growth 8542.31 Electronic Integrated Circuits — Processors & Controllers $12.4B Japan, South Korea, Taiwan 0% +11.8% 2710.19 Petroleum Oils — Other (Diesel, Fuel Oil, Jet Fuel) $14.8B Saudi Arabia, UAE, South Korea 0–3% +3.4% 8517.62 Machines for Receiving & Transmitting Voice/Data $5.6B China, Finland, Sweden 0–5% +14.2% 8471.30 Portable Digital Computers — Laptops, Tablets $4.9B China, Taiwan, Japan 0% +9.7% 8703.23 Motor Cars — Piston Engine, 1500–3000cc Cylinder $3.7B Japan, South Korea, China 5–30% +13.1% 7208.10 Flat-rolled Iron/Steel, Width ≥ 600mm, Hot-rolled $4.1B China, Japan, South Korea 3–7% +4.8% 1006.30 Semi-milled or Wholly Milled Rice $3.2B Vietnam, Thailand, India 35% +5.9% 3901.10 Polyethylene, Specific Gravity < 0.94 (Granules) $2.4B Saudi Arabia, China, USA 3–7% +4.1% 8708.99 Parts & Accessories of Motor Vehicles (Other) $2.9B Japan, South Korea, China 5–10% +10.3% 9018.90 Medical, Surgical, Dental Instruments (Other) $2.8B USA, Germany, Japan 0–3% +12.6% 8544.42 Electric Conductors — Fitted with Connectors, ≤1000V $2.1B China, Japan, Taiwan 0–5% +6.8% 2601.11 Iron Ore & Concentrates (Non-agglomerated) $1.8B Australia, Brazil, India 0% +2.1% 8536.90 Electrical Apparatus — Switching/Protecting Circuits ≤1000V $1.6B Japan, China, Germany 0–5% +9.4% 8525.80 Television Cameras, Digital Cameras & Camcorders $1.4B Japan, China, South Korea 0–10% +16.2% 8507.60 Lithium-Ion Batteries & Battery Packs $1.3B China, South Korea, Japan 0–5% +28.4% The standout story in this HS code breakdown is HS 8507.60 (Lithium-Ion Batteries) — growing at 28.4% year-on-year. This reflects the rapid expansion of renewable energy storage installations, EV adoption incentives under the Philippine EV Industry Development Act, and the BPO sector’s expanding battery backup infrastructure. For
Philippines Import Data by HS Code – Detailed Trade Insights
Philippines Import Data by HS Code 2026: Complete Guide to HS Code Search & Trade Intelligence Home › Trade Data › Philippines Import Data › Philippines Import Data by HS Code HS Code Intelligence 2026 Philippines Import Data by HS Code: Complete Search Guide & Trade Statistics The most comprehensive guide to searching Philippines import data by HS code — covering top imported HS chapters, shipment volumes, duty rates, importer records, and how to leverage HS code intelligence for sourcing, compliance, and market research in 2026. Updated: April 2026 14 min read Philippines HS Code Data Quick Philippines HS Code Lookup Enter an HS code or product keyword to find import data details, duty rates, and top source countries for the Philippines. Search HS Code 5,000+Active HS Codes in PH Imports $145B+Total Import Value 2025 HS 85Largest Import HS Chapter 99Total HS Chapters Tracked MT Malaysia Trade Data Research Team Trade Intelligence Analysts · Published April 17, 2026 · 14 min read When businesses and trade professionals search for Philippines import data by HS code, they are looking for one of the most powerful forms of trade intelligence available: shipment-level records organized by the internationally standardized Harmonized System (HS) classification. Every product crossing into the Philippines through any port of entry is assigned an HS code by the Bureau of Customs (BOC), and this classification determines tariff rates, import licensing requirements, statistical reporting, and trade partner analysis. This guide delivers a complete breakdown of how Philippines HS code import data works, which HS chapters dominate Philippine import flows, how to search and interpret HS code records, and how businesses can use this intelligence for procurement, market entry, compliance, and competitive analysis in 2026. What Is HS Code Import Data for the Philippines? The Harmonized System (HS) is a globally standardized nomenclature developed by the World Customs Organization (WCO) and used by 200+ countries to classify traded goods. The Philippines adopts the ASEAN Harmonized Tariff Nomenclature (AHTN) — a regional extension of the HS — which aligns with the 6-digit international HS code at the chapter, heading, and subheading level, with additional national digits for local tariff line specificity. How HS Codes Work: A Philippines HS code like 8542.31.10 breaks down as follows — Chapter 85 (Electrical machinery), Heading 8542 (Electronic integrated circuits), Subheading 8542.31 (Processors and controllers), National tariff line .10 (specific Philippine classification). Each level unlocks progressively more specific import data, duty rates, and regulatory requirements. When you search Philippines import data by HS code, you are drilling into these layers to find real shipment records. For businesses tracking regional trade patterns — including those already analyzing Malaysia import data or studying Vietnam import data — the HS code provides a universal language for comparing trade flows across countries. The same HS 8542.31 code that describes semiconductor imports into the Philippines is used identically in Thailand, Vietnam, Malaysia, and every other country in the world. Top HS Chapters in Philippines Import Data 2026 Understanding which HS chapters drive the largest import volumes in the Philippines gives exporters, analysts, and logistics professionals an immediate picture of where market demand is concentrated. Here are the top HS chapters by import value in the Philippines for 2025–2026: HS Chapter 85 $28.6B Electrical Machinery, Electronics & Components Top SourceJapan, South Korea, China Key ProductsICs, semiconductors, phones MFN Duty Rate0–15% +10.4% YoY HS Chapter 27 $22.4B Mineral Fuels, Oils & Petroleum Products Top SourceSaudi Arabia, UAE, South Korea Key ProductsCrude oil, diesel, LNG, coal MFN Duty Rate0–3% +3.8% YoY HS Chapter 84 $16.8B Machinery, Mechanical Appliances & Equipment Top SourceJapan, China, Germany Key ProductsTurbines, pumps, computers, CNC MFN Duty Rate0–10% +8.9% YoY HS Chapter 87 $9.4B Vehicles, Cars & Automotive Parts Top SourceJapan, South Korea, China Key ProductsPassenger cars, trucks, auto parts MFN Duty Rate5–30% +12.6% YoY HS Chapter 72–73 $8.7B Iron, Steel & Articles of Iron or Steel Top SourceChina, Japan, South Korea Key ProductsFlat steel, rebar, pipes, structures MFN Duty Rate3–15% +5.3% YoY HS Chapter 10 $3.2B Cereals — Rice, Wheat & Grains Top SourceVietnam, Thailand, India Key ProductsMilled rice, wheat, corn MFN Duty Rate35–50% +6.1% YoY Philippines Import Data: Detailed HS Code Breakdown Beyond chapter-level analysis, Philippines import data by HS code becomes most actionable at the 6-digit and 8-digit subheading level. Here is a detailed breakdown of the most searched and highest-volume HS codes in Philippine customs import records for 2026: HS Code Product Description Import Value (2025) Top 3 Source Countries MFN Duty Growth 8542.31 Electronic Integrated Circuits — Processors & Controllers $12.4B Japan, South Korea, Taiwan 0% +11.8% 2710.19 Petroleum Oils — Other (Diesel, Fuel Oil, Jet Fuel) $14.8B Saudi Arabia, UAE, South Korea 0–3% +3.4% 8517.62 Machines for Receiving & Transmitting Voice/Data $5.6B China, Finland, Sweden 0–5% +14.2% 8471.30 Portable Digital Computers — Laptops, Tablets $4.9B China, Taiwan, Japan 0% +9.7% 8703.23 Motor Cars — Piston Engine, 1500–3000cc Cylinder $3.7B Japan, South Korea, China 5–30% +13.1% 7208.10 Flat-rolled Iron/Steel, Width ≥ 600mm, Hot-rolled $4.1B China, Japan, South Korea 3–7% +4.8% 1006.30 Semi-milled or Wholly Milled Rice $3.2B Vietnam, Thailand, India 35% +5.9% 3901.10 Polyethylene, Specific Gravity < 0.94 (Granules) $2.4B Saudi Arabia, China, USA 3–7% +4.1% 8708.99 Parts & Accessories of Motor Vehicles (Other) $2.9B Japan, South Korea, China 5–10% +10.3% 9018.90 Medical, Surgical, Dental Instruments (Other) $2.8B USA, Germany, Japan 0–3% +12.6% 8544.42 Electric Conductors — Fitted with Connectors, ≤1000V $2.1B China, Japan, Taiwan 0–5% +6.8% 2601.11 Iron Ore & Concentrates (Non-agglomerated) $1.8B Australia, Brazil, India 0% +2.1% 8536.90 Electrical Apparatus — Switching/Protecting Circuits ≤1000V $1.6B Japan, China, Germany 0–5% +9.4% 8525.80 Television Cameras, Digital Cameras & Camcorders $1.4B Japan, China, South Korea 0–10% +16.2% 8507.60 Lithium-Ion Batteries & Battery Packs $1.3B China, South Korea, Japan 0–5% +28.4% The standout story in this HS code breakdown is HS 8507.60 (Lithium-Ion Batteries) — growing at 28.4% year-on-year. This reflects the rapid expansion of renewable energy storage installations, EV adoption incentives under the Philippine EV Industry Development Act, and the BPO sector’s expanding battery backup infrastructure. For
Philippines Import Data: Trade Statistics, Trends & Market Insights (2026)
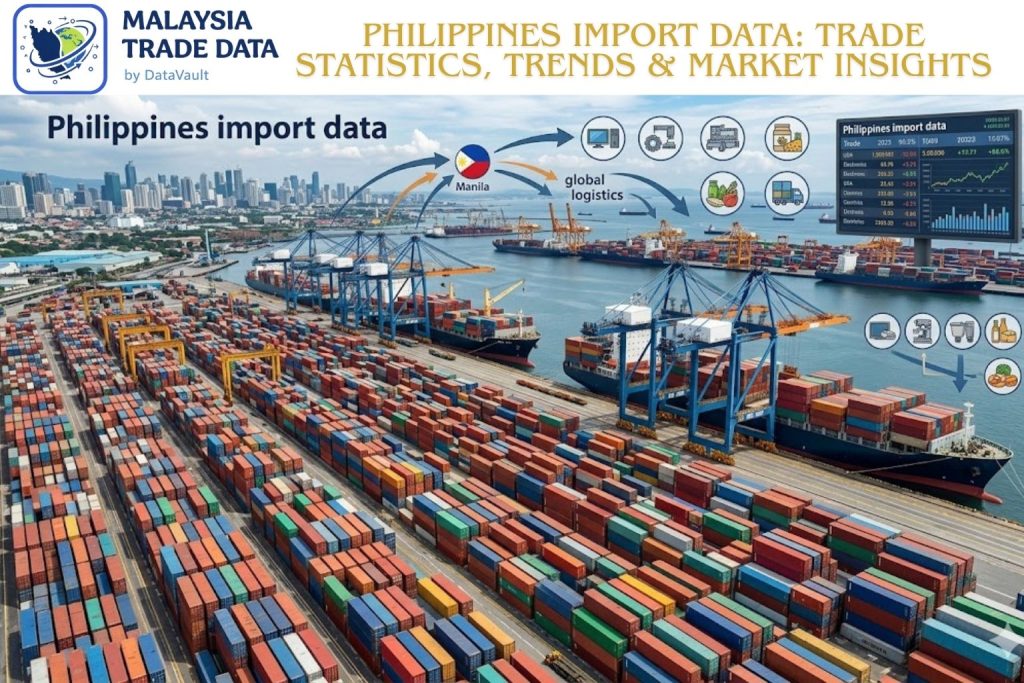
Philippines Import Data 2026: Trade Statistics, Trends & Market Insights Home › Trade Data › Philippines Import Data 2026 Trade Intelligence 2026 Philippines Import Data: Trade Statistics, Trends & Market Insights An in-depth analysis of the Philippines’ 2026 import landscape — covering top imported commodities, HS code intelligence, major trading partners, customs procedures, and untapped market opportunities for businesses targeting one of Southeast Asia’s fastest-growing economies. Updated: April 2026 13 min read Philippines Trade Data $145B+Total Import Value (2025 est.) $78B+Total Export Value (2025 est.) 180+Global Trading Partners +7.4%YoY Import Growth Rate MT Malaysia Trade Data Research Team Trade Intelligence Analysts · Published April 17, 2026 · 13 min read The Philippines is one of Southeast Asia’s most import-reliant economies, and analyzing Philippines import data in 2026 reveals a nation undergoing rapid industrial transformation fueled by foreign investment, infrastructure spending, and a booming digital economy. As an archipelago of over 7,600 islands with limited domestic manufacturing of certain goods, the Philippines depends heavily on imports for energy, electronics, machinery, food, and consumer products. Whether you are an exporter targeting Filipino buyers, a market researcher tracking Philippines trade statistics, or a logistics professional monitoring Philippines customs data, this comprehensive guide delivers the intelligence you need. From HS codes and top trading partners to emerging market opportunities, this analysis covers every critical dimension of Philippines trade data 2026. Philippines Trade Overview 2026 The Philippines recorded total import value exceeding $145 billion in 2025, driven by sustained infrastructure investment under the Build Better More (BBM) program and strong consumer demand from a young, growing population of over 115 million people. The country’s trade deficit — a persistent structural feature — reflects its dependence on imported energy and industrial inputs that domestic production cannot fully supply. Key Insight: The Philippines runs one of ASEAN’s largest trade deficits as a share of GDP, primarily because its export base — while growing in electronics and services — does not fully offset import demand for petroleum, machinery, and raw materials. Tracking Philippines HS code data reveals that electronics components represent both the country’s largest import AND largest export category, reflecting a classic processing-trade structure where components are imported, assembled, and re-exported. For businesses already tracking Malaysia import data or studying Vietnam import data, the Philippines represents a distinct market opportunity — one defined more by consumer demand and infrastructure-driven imports than by the export-oriented manufacturing model that dominates Thailand and Vietnam. Comparing Thailand import export data with Philippine patterns highlights this fundamental structural difference between ASEAN economies. Philippines Top Imported Products (2026) The Philippines’ import basket is shaped by three dominant forces: energy dependency, electronics processing trade, and infrastructure-driven capital goods demand. Here is a comprehensive breakdown of the most significant Philippines import categories by value in 2025–2026: # Product Category HS Chapter Est. Value (2025) YoY Growth Status 1 Electronic Products & Components HS 85 $28.6B +10.4% Top Category 2 Mineral Fuels & Petroleum Products HS 27 $22.4B +3.8% Dominant 3 Industrial Machinery & Equipment HS 84 $16.8B +8.9% Growing 4 Transport Equipment & Vehicles HS 86–87 $10.2B +12.6% Fast Growing 5 Iron, Steel & Metal Articles HS 72–73 $8.7B +5.3% Stable 6 Cereals, Grains & Food Products HS 10–23 $7.9B +6.1% Stable 7 Plastics & Articles Thereof HS 39 $6.4B +4.8% Stable 8 Organic & Inorganic Chemicals HS 28–29 $5.8B +3.6% Stable 9 Textile Fabrics & Apparel Inputs HS 50–63 $4.6B +2.9% Stable 10 Medical Devices & Instruments HS 90 $4.1B +11.2% Fast Growing The dual dominance of electronics (HS 85) and petroleum (HS 27) in Philippines import statistics defines the country’s core trade dependencies. Electronics components flow in primarily from Japan, China, South Korea, and Taiwan to feed the Philippines’ semiconductor and electronics assembly industries — primarily concentrated in the Clark and Laguna economic zones. Meanwhile, petroleum imports reflect the Philippines’ near-complete dependence on foreign oil and LNG, making energy price fluctuations a significant driver of its overall Philippines trade balance. The fast-growing transport equipment sector (+12.6%) reflects both rising vehicle demand from an expanding middle class and the government’s infrastructure investment in railway systems, port upgrades, and road expansion under the $180B+ national infrastructure program. Philippines’ Major Import Source Countries The Philippines sources its imports from a concentrated set of partners, with China, Japan, and South Korea collectively supplying over half of all import value. Here is the import partner share breakdown for Philippines bilateral trade data 2026: China24.1% Japan14.3% South Korea9.2% USA7.8% Indonesia6.3% Thailand5.4% Malaysia4.2% Taiwan3.9% Others24.8% China’s 24.1% import share reflects a broad product range — from electronics and machinery to consumer goods and construction materials. Businesses monitoring China import export data will note that China’s exports to the Philippines have grown at double-digit rates for five consecutive years, particularly in solar panels, EV components, and digital infrastructure equipment. Thailand’s 5.4% share, though smaller, is strategically significant — it covers automotive parts, food products, and petrochemicals flowing from Thai manufacturers into Philippine supply chains. This makes Thailand import export data a useful complementary dataset for businesses tracking regional supply chains that pass through the Philippines. Similarly, businesses analyzing Indonesia import export data should note that Indonesia is the Philippines’ fifth-largest supplier, primarily for coal, palm oil, and mineral products. Key HS Codes in Philippines Import Data For trade professionals working with Philippines HS code search and Philippines customs records, these HS chapters and codes represent the highest-volume activity in the Philippines’ 2026 import registry: HS Code Product Description Annual Import Value Top Source Countries Data Availability 8542.31 Integrated Circuits & Semiconductors $12.4B Japan, South Korea, Taiwan Full Records 2710.19 Petroleum Oils & Refined Products $14.8B Saudi Arabia, UAE, South Korea Full Records 8517.62 Telecom Equipment & Base Stations $5.6B China, Finland, USA Full Records 8471.30 Laptops & Data Processing Equipment $4.9B China, Taiwan, Japan Full Records 8703.23 Passenger Motor Vehicles $3.7B Japan, South Korea, China Available 1006.30 Rice (Semi-milled & Milled) $3.2B Vietnam, Thailand, India Available 7208.10 Flat-rolled Steel Products $4.1B China, Japan, South Korea Available 9018.XX Medical & Surgical
Vietnam Import Data: Key Trade Insights, Top Imports & Market Opportunities (2026)
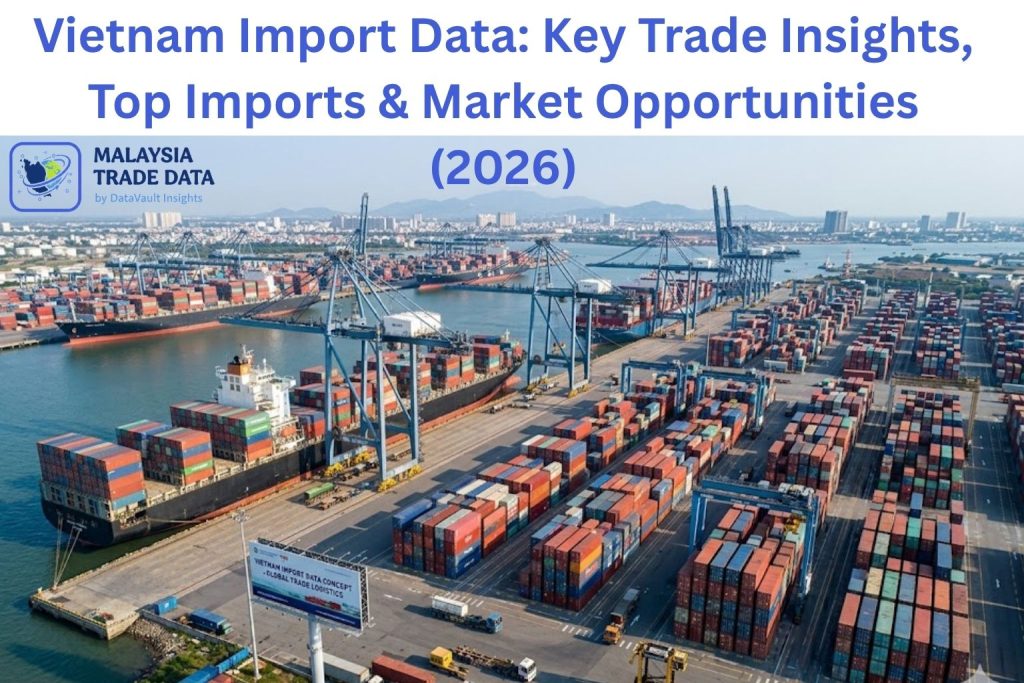
Vietnam Import Data 2026: Key Trade Insights, Top Imports & Market Opportunities Home › Trade Data › Vietnam Import Data 2026 Trade Intelligence 2026 Vietnam Import Data: Key Trade Insights, Top Imports & Market Opportunities Discover the most comprehensive analysis of Vietnam’s import landscape for 2026 — from top imported commodities and HS codes to major trading partners and untapped market opportunities for global businesses. Updated: April 2026 12 min read Vietnam Trade Data $380B+ Total Import Value (2025 est.) 180+ Trading Partner Countries Top 3 Electronics Import Hub ASEAN 8.5% YoY Import Growth Rate MT Malaysia Trade Data Research Team Trade Intelligence Analysts · Published April 15, 2026 · 12 min read Vietnam has emerged as one of Southeast Asia’s most dynamic trading economies, and analyzing Vietnam import data in 2026 reveals a nation deeply integrated into global supply chains. Whether you are an exporter seeking new market entry points, a researcher tracking Vietnam trade statistics, or a logistics professional monitoring Vietnam customs data, this comprehensive guide offers the insights you need. Vietnam’s rapid industrialization, fueled by foreign direct investment and strong manufacturing export growth, has equally driven demand for a diverse range of imports — from industrial machinery and electronics to raw materials and consumer goods. Understanding this import landscape is critical for businesses looking to leverage Vietnam market opportunities in 2026. Vietnam Trade Overview 2026 Vietnam’s total trade volume has grown dramatically over the past decade, and 2026 continues that trajectory. The country’s integration into major free trade agreements — including the CPTPP, EVFTA, and RCEP — has created both tariff advantages and increased import competition. Vietnam import export data for 2025–2026 reflects a balanced yet import-heavy trade profile in key industrial sectors. Key Insight: Vietnam’s manufacturing sector depends heavily on imported inputs — especially from China, South Korea, and Japan. Electronics, integrated circuits, and machinery collectively account for over 45% of Vietnam’s total import value, making these categories critical watchpoints for trade analysts using Vietnam HS code data. For businesses operating in the Malaysia import data space, Vietnam represents both a competitor and a complementary market — as both nations source heavily from China and route goods through similar ASEAN corridors. Understanding regional trade dynamics, including Malaysia export data flows, helps traders position themselves optimally across the region. Top Imported Products in Vietnam (2026) Vietnam’s import basket is dominated by industrial inputs supporting its massive electronics assembly and textile export industries. Below is a breakdown of the most significant Vietnam top import categories by value, based on 2025 trade data and 2026 projections. # Product Category HS Code Range Est. Import Value (2025) YoY Growth Status 1 Electrical Machinery & Electronics HS 85 $68.4B +11.2% Top Category 2 Machinery, Mechanical Appliances HS 84 $45.7B +9.4% High Volume 3 Iron & Steel Products HS 72–73 $18.2B +5.6% Stable 4 Plastic Materials & Articles HS 39 $14.9B +7.1% Growing 5 Organic Chemicals HS 29 $12.3B +4.8% Stable 6 Woven Fabrics & Textiles HS 52–63 $11.8B +3.9% Stable 7 Vehicles & Automotive Parts HS 87 $9.6B +12.3% Fast Growing 8 Fuel & Mineral Products HS 27 $8.9B –1.2% Declining 9 Optical & Medical Instruments HS 90 $7.4B +8.7% Growing 10 Cotton, Yarn & Thread HS 52 $6.1B +2.4% Stable The dominance of electronics (HS 85) in Vietnam import statistics is a direct reflection of the country’s role as a global assembly hub for companies like Samsung, LG, and Intel. Vietnam imports billions of dollars worth of electronic components, semiconductors, and integrated circuits annually, making Vietnam electronics import data one of the most closely watched metrics in Asian trade intelligence. Vietnam’s Major Import Source Countries Understanding where Vietnam sources its imports is crucial for exporters and market researchers. Vietnam bilateral trade data consistently shows China as the dominant supplier, followed by South Korea, Japan, and Taiwan. Here’s the import share breakdown for key trading partners: China 38.2% South Korea 18.1% Japan 8.3% Taiwan 7.1% USA 5.4% Thailand 4.2% Malaysia 3.6% Others 15.1% China’s 38% share of Vietnam import data is primarily concentrated in electronics components, machinery, and textiles — all inputs to Vietnam’s export-oriented manufacturing sector. For businesses analyzing China import export data, Vietnam’s import dependency on China is a key indicator of upstream supply chain flows across the region. South Korea’s 18% share is largely driven by Samsung’s massive manufacturing presence in Vietnam, with billions of dollars in component trade between Korean semiconductor fabs and Vietnamese assembly plants. Similarly, businesses tracking Indonesia import export data will notice parallel patterns — both nations rely on East Asian technology suppliers to fuel their manufacturing ecosystems. Key HS Codes in Vietnam Import Data For trade professionals working with Vietnam customs data and Vietnam HS code search, understanding which HS chapters dominate Vietnam’s import registry is essential for targeting the right buyers and importers. HS Chapter Description Key Products Annual Volume HS 8542 Integrated Circuits Semiconductors, ICs, Microprocessors $28.4B HS 8517 Telephone & Comm Equipment Smartphones, Routers, Modules $18.7B HS 8471 Computers & ADP Equipment Laptops, Servers, Computing Parts $12.2B HS 7207 Semi-finished Steel Products Steel billets, Slabs $8.9B HS 3901–3926 Plastics & Articles Plastic Granules, Packaging, Films $7.6B HS 8708 Automotive Parts Engine Parts, Transmission, Chassis $5.8B Accessing detailed Vietnam shipment data by HS code allows businesses to identify specific importers, track shipment frequency, and understand pricing trends. Platforms offering Vietnam bill of lading data and Vietnam customs records provide granular views into which companies are importing what, from whom, and at what volumes. Market Opportunities in Vietnam 2026 The Vietnam import market presents several high-growth opportunities for exporters worldwide. Based on current import trend data, the following sectors are experiencing above-average demand growth: Renewable Energy Equipment Vietnam’s solar and wind energy targets are driving demand for inverters, turbine components, and grid equipment. Imports in this segment grew 34% in 2025. Advanced Machinery & Automation Vietnam’s push toward Industry 4.0 is fueling imports of CNC machines, robotics, and industrial automation systems from Germany, Japan, and South Korea. Construction Materials Infrastructure development
Sri Lanka Import Data: Complete Guide for Global Traders (2026)
Introduction Sri Lanka import data is an essential source for businesses looking to expand their operations in expanding into the South Asian market. Due to the growing globalization of trade and the increasing importance of understanding trends in imports is essential for manufacturers, exporters and traders. Sri Lanka, being strategically situated within its geographical location in Indian Ocean, serves as an important trading hub that connects Asia as well as other markets around the world. Sri Lanka imports broad variety of goods to meet the demand of its domestic market and to support its industries. Through the analysis of Sri Lanka import data, companies will gain valuable insights into trends in the market, spot profitable opportunities and make well-informed decisions. If you’re a novice exporter or a seasoned business with a solid trade information can provide you with an advantage in the market. What exactly is Sri Lanka Import Data? Sri Lanka import data refers to precise records of the imports of goods into the country. The data contains vital information that can help businesses to understand the patterns of trade and market behaviour. The most important components that make up Sri Lanka import data include: This data allows businesses to determine which products are popular and who the main buyers are in addition to how flows of commerce change with time. It is frequently utilized by companies to conduct market research and strategic planning. A Review of Sri Lanka’s Import Market Sri Lanka has a diverse import market that is driven by the growing population and industrial demands. The country is dependent on imports of fuel and machinery, food items as well as raw materials. Principal trading partners include India, China, the United Arab Emirates, Singapore as well as Malaysia. The demand for imports is increasing due to the urbanization process and economic growth. Companies that recognize these trends will be better positioned themselves to be able to enter market Sri Lankan market successfully. Major products imported by Sri Lanka Knowing the most important import products is crucial for exporters who want to target this market. Some of the most significant imports are: By studying these categories, companies can determine the most popular sectors and adjust their offerings according to the demand. Benefits of using Sri Lanka Import Data Market Research Sri Lanka import data helps companies understand the current demand for Sri Lanka as well as emerging trends and the preferences of consumers. This lets companies concentrate on the products that are most profitable. Find reliable buyers With the importer’s information available Businesses can easily connect with potential buyers and create long-term relationships. Analyzing Competitors Companies can keep track of the shipments of their competitors, pricing strategies and market presence to enhance their own strategies for business. Risk Reduction The accuracy of trade data can help reduce risk by giving instantaneous insight into market conditions as well as the fluctuations in demand. Global Expansion Companies can make use of this information to discover new possibilities and to expand into new markets internationally with confidence. The way Sri Lanka Import Data Helps businesses grow By using Sri Lanka import data, businesses can make more informed choices and boost the overall efficiency of their international trade. It allows companies to: For instance for instance, if a firm is looking to export its machinery in Sri Lanka, analyzing import data will reveal what kinds of machines are in demand and which firms are importing these machines regularly. Connectivity Dependable Sri Lanka Import Data To get the most value from Sri Lanka import data, it is crucial to select a reliable and trustworthy source. A reliable source of data provides better insights and can help businesses avoid costly errors. For detailed trade insights and reports, visit:https://malaysiatradedata.com/ This platform gives comprehensive import-export information that can help businesses to stay ahead of competitors in the market. Conclusion Sri Lanka import data is an extremely useful tool for businesses seeking to be successful on the international stage. It provides valuable information about the market’s trends, demand for products and trade activity. With this information companies can discover new opportunities, communicate potential buyers and optimize strategies overall. As the world’s trade market is evolving it is essential to have reliable and current import data is essential to long-term success. Companies that use Sri Lanka import data effectively will have a distinct advantage over their rivals and experience long-term growth.
Malaysia Import Data: Key Products, Suppliers & Market Trends (2026)
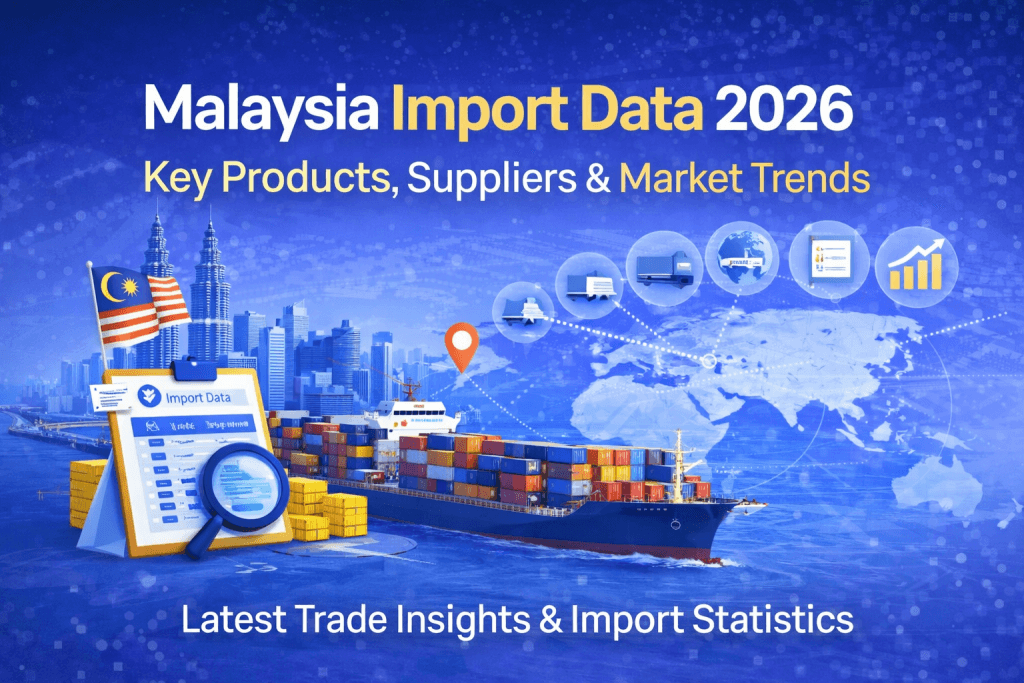
Introduction Malaysia is among the largest countries in the trading industry of Southeast Asia. With a robust manufacturing sector, modern logistics infrastructure and an advantageous place of residence, the country imports many different products from the world market. For companies that are who trade internationally it is essential to understand Malaysia import information is crucial to find sources, evaluate the market’s demand, and monitor market trends. In this guide to 2026 we examine the significance of Malaysia import data, key trade with partners and the ways companies can benefit from this information to make more informed trade decisions. What is Malaysia Import Information? Malaysia import data is a reference to customs records that monitor the flow of goods into the country. These data provide valuable insights into trade and business activities. It also contains specifics like: Since the information is based on actual transaction in the customs system, it provides accurate insights into Malaysia’s import market. The Major Import Products of Malaysia Malaysia imports a broad range of goods and services to aid its industry and consumer markets. The most sought-after imported items from Malaysia are: Electronic and electrical components Malaysia’s electronics manufacturing industry needs an enormous amount of imported circuits, semiconductors and electronic components. and Industrial Equipment. and Industrial Equipment Mechanical and industrial machinery are imported to aid in the development of infrastructure and manufacturing. Chemicals and Industrial Materials A variety of chemicals as well as raw material are sourced to manufacture industrial products. Transport Equipment Malaysia imports automobiles, parts, as well as transportation equipment from suppliers around the world. Petroleum Products Refined petroleum products and related items are included in the imports portfolio of Malaysia. Leading Countries that Export to Malaysia Malaysia is a major importer of goods and services from numerous world markets. The most important trading partners that supply goods that are shipped to Malaysia comprise: An analysis of country-wise Malaysia import data can help businesses to understand which market dominates the supply chain. How businesses use Malaysia Import Data Companies across industries depend upon Malaysia import data for a variety of reasons: Supplier Identification Importers can find the active manufacturers and exporters that supply goods to Malaysia. Market Research Trade data allows companies to analyze trends in demand and pinpoint growing product categories. Analyzing Competitors Companies can monitor competitor shipping and sourcing strategies. Trade Opportunity Discovery Import data suggests potential possibilities for suppliers to tap Malaysia. Malaysian market. Benefits of using accurate import Data Making use of precise Malaysia import data can offer a variety of advantages: Trade data that is reliable allows businesses to make better business decisions, instead of being reliant on a few assumptions. How to access reliable Malaysia Import Information? Businesses have access to Malaysia import information through expert trade intelligence systems which collect and organize customs shipping records. Platforms like MalaysiaTradeData.com provide detailed Malaysia import export data, helping traders, importers, and analysts understand market trends and identify potential business opportunities. Conclusion The growing economy of Malaysia and its strong commerce networks have made it a vital marketplace for suppliers from around the world. Knowing Malaysia import statistics helps businesses analyze demand, pinpoint active importers, and discover new opportunities for trade. Utilizing accurate customs shipment information, businesses can cut down on the risk of sourcing, enhance their strategies for sourcing and grow successfully internationally.
Malaysia Import Data: Market Insights, Trade Trends & Import Statistics

Introduction Global Economic Development relies greatly on trade. When you know the imports of items from Malaysia and other countries, companies will be able to take educated decisions regarding global trade activity. Malaysia is experiencing a rapid growth rate in its economy compared to all Southeast Asian countries; the country is a major importer of electronic equipment machines, parts for machines, and petroleum-based products. Researchers, companies and people looking for jobs in the field of international trade depend on trade statistics of Malaysia for analysis. What is Malaysia Import Data? Malaysia import data are precise records of imports of goods into Malaysia in other foreign countries. These data are gathered by customs officials and trade departments. Common information contained in Malaysia export shipment records: Through the analysis of Malaysia export data, businesses are able to gain an understanding of the import market of Malaysia and find lucrative opportunities. Malaysia Import Market Overview Malaysia imports a broad range of goods including electronics, machinery, petroleum products and other chemicals. Malaysia’s booming manufacturing industry results in a huge demand for raw materials and components imported from abroad. Malaysia Principal Import Categories Product Category Estimated share of imports Electrical & Electronic Products 30% Machinery & Equipment 15% Petroleum Products 12% Chemicals 8% Transport Equipment 7% They dominate the Malaysia export market, which makes Malaysia a desirable destination for international exporters. Sample Data on Malaysia Imports Below is a simplified version that illustrates Malaysia import shipment information used to analyze trade. Date Importer Product Quantity Origin Country Port 12 Jan 2025 Penang Electronics Ltd Microchips 10,000 units Taiwan Port Klang 05 February 2025 KL Machinery Sdn Bhd Industrial Machines 200 units Germany Port Klang 21 February 2025 Johor Chemical Industries Chemical Compounds 5 000 kg China Tanjung Pelepas This kind of Malaysia import and customs data can help companies understand the supplier network and trends in shipment. The benefits in Malaysia Import Data 1. Market Research Businesses can look over Malaysia import statistics to determine what products are most sought-after. 2. Analysis of Competitors Companies can track imports of competitors and know their supply chain. 3. Supplier Identification By using Malaysia trade statistics, businesses are able to find trustworthy international suppliers. 4. Price Benchmarking Import values enable companies to examine pricing trends within Malaysia. Malaysian market. 5. Business Expansion Exporters can benefit from Malaysia import market data to help expand their business in Southeast Asia. Who is the User of Malaysia Import Data? Numerous industries rely on Malaysia import trade statistics: They use statistics on imports to help them improve their strategies for global trade. Conclusion Malaysia import data can provide valuable insight into the country’s trade operations as well as market demands. Through analysing Malaysia export and shipment data, companies can spot new opportunities, identify reliable suppliers, and grow their reach in market Southeast Asian market. Companies that use Malaysia trade data have a significant competitive edge for international business.