Malaysia Rubber Glove Export Data – HS Code 4015
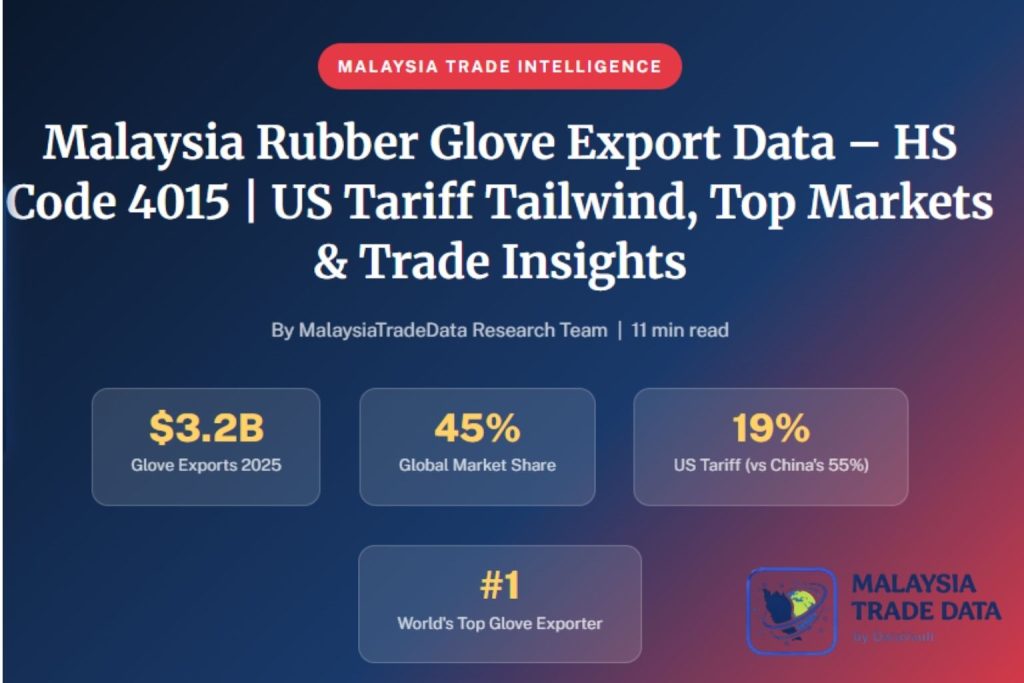
Malaysia Rubber Glove Export Data – HS Code 4015 Guide 🧤 Malaysia Rubber Glove Exports Hold Steady at $3.2 Billion in 2025 as US Tariffs on Chinese Gloves Jump to 55% Malaysia Trade Intelligence Malaysia Rubber Glove Export Data – HS Code 4015 | US Tariff Tailwind, Top Markets & Trade Insights By MalaysiaTradeData Research Team | 11 min read $3.2B Glove Exports 2025 45% Global Market Share 19% US Tariff (vs China’s 55%) #1 World’s Top Glove Exporter Home › Blog › Malaysia Rubber Glove Export Data – HS Code 4015 Malaysia’s rubber glove exports (HS Code 4015) held steady at roughly $3.2 billion in 2025, capturing an estimated 45% of the global glove market. Behind that stable headline number sits one of the most dramatic boom-bust-recovery cycles in Malaysian trade — and a fresh US tariff shift that could reshape the industry’s next few years. This guide covers the full trend, top export markets, and the tariff story every buyer and sourcing manager should know. Malaysia Rubber Glove Export Market Overview Malaysia is the world’s largest exporter of rubber gloves, built on a production ecosystem of major manufacturers including Top Glove, Hartalega, Kossan, and Supermax. For decades, this sector has been a cornerstone of Malaysia’s commodities trade. However, few export categories have swung as violently as rubber gloves did between 2020 and 2023. The COVID-19 pandemic triggered an extraordinary demand spike. As a result, exports rocketed from roughly $8.6 billion in 2020 to a record $13.2 billion in 2021. Once pandemic-era demand normalized, however, the correction was equally dramatic. Exports fell to around $4.3 billion in 2022, then to just $2.6 billion in 2023 — a nearly 80% decline from the 2021 peak. Since then, the industry has stabilized and modestly recovered, reaching approximately $3.2 billion in 2025. 🧤 Malaysia Rubber Glove (HS 4015) Export Key Statistics — 2025 Metric Value Total Glove Export Value (2025) ~$3.2 Billion (RM14.0B) Global Market Share ~45% Peak Export Year 2021 — $13.2 Billion Post-Pandemic Low 2023 — $2.6 Billion US Tariff on Malaysian Gloves (2025) 19% US Tariff on Chinese Gloves (2025) 55% Source: MalaysiaTradeData.com Research Malaysia Rubber Glove Export Value — 2020 to 2025 Trend Few Malaysian export categories illustrate the pandemic’s economic whiplash as clearly as rubber gloves. Exports more than doubled between 2020 and 2021 as global healthcare systems scrambled for supply. Then, over the following two years, values collapsed by nearly 80% as demand normalized and global oversupply set in. Since 2024, however, the sector has found a steadier footing, growing modestly each year. 📊 Malaysia Rubber Glove (HS 4015) Export Value — 2020 to 2025 (USD Billion) 2020$8.6B 2021$13.2B ★ 2022$4.3B 2023$2.6B 2024$3.0B 2025$3.2B Source: MalaysiaTradeData Research (RM converted to USD) Year Export Value (USD) YoY Growth 2020 $8.6 Billion — 2021 $13.2 Billion ▲ 52.6% 2022 $4.3 Billion ▼ 65.3% 2023 $2.6 Billion ▼ 37.9% 2024 $3.0 Billion ▲ 16.1% 2025 $3.2 Billion ▲ 2.2% Malaysia’s Top Rubber Glove Export Markets The United States and the European Union have consistently been Malaysia’s two largest glove markets. In fact, together they absorbed roughly 61.5% of Malaysia’s total glove exports during the 2021 pandemic peak, when the US alone purchased approximately $5.16 billion worth of Malaysian gloves in a single year. By 2023, the US still accounted for around 35% of Malaysia’s total glove exports. 🌍 Malaysia’s Rubber Glove Market Share of US Imports — 2020 vs 2025 🇺🇸 US Share 2020–2023 Avg Malaysia 55% 🇺🇸 US Share Currently (2025) Malaysia 44% Source: MalaysiaTradeData.com — Malaysia’s share of total US glove imports (not share of Malaysia’s exports) Why Malaysia’s US Market Share Slipped — Then Why It May Recover Malaysia’s share of the US glove import market fell from an average of 55% (2020–2023) to around 44% currently, as Chinese manufacturers undercut prices during the post-pandemic oversupply period. Notably, however, this trend may be reversing. The US raised tariffs on Chinese-made medical gloves from 7.5% to 50% in 2025, with a further increase to 100% planned for 2026. Meanwhile, as of mid-2025, Malaysian and Thai goods face a considerably lower 19% US tariff, versus 55% for China under the broader tariff framework — giving Malaysian exporters a meaningful pricing advantage heading into 2026. 📖 Also Read: Malaysia Rubber Export Data See Malaysia’s broader semiconductor export trends Malaysia Import Export Data | Complete Trade Guide A Note on HS Code Scope: Gloves vs. Surgical Gloves Specifically HS Code 4015 covers all rubber gloves broadly — medical examination gloves, industrial gloves, and household gloves alike. A narrower sub-classification, HS 401511 (rubber surgical gloves specifically), tells a related but distinct story. According to global trade data, Malaysia exported approximately $2.19 billion worth of surgical gloves specifically in 2024, ahead of China ($1.41 billion) and Thailand ($886 million) — confirming Malaysia’s leadership even within this more specific product category. What’s Driving the Rubber Glove Trade Story Now 1. The US-China Tariff Gap The single biggest near-term factor is the widening tariff gap between Malaysia and China in the US market. As Chinese medical glove tariffs climb toward 100% by 2026, Malaysian manufacturers gain a substantial cost advantage. Consequently, industry observers widely expect this to help Malaysia recover lost US market share. 2. Post-Pandemic Demand Normalization The dramatic 2022–2023 decline mainly reflected the unwinding of pandemic-era stockpiling and oversupply, rather than a genuine collapse in underlying demand. Therefore, the 2024–2025 stabilization likely represents a return to a more sustainable, structurally higher demand baseline than pre-pandemic levels. 3. Raw Material and Supply Chain Pressure More recently, however, the industry has faced new cost pressures. Disruptions in the Strait of Hormuz have pushed up Brent crude prices, which directly affects the cost of nitrile butadiene rubber (NBR) — the primary raw material for nitrile gloves. As a result, manufacturers are managing rising input costs even as export volumes stabilize. 🔍 Get Verified Malaysia Trade Data Access shipment-level Malaysia import/export data with HS codes, buyer details, supplier names, and trade records. Perfect for market
Malaysia Palm Oil Export Data 2026: Top Buyers, HS Codes & Trade Insights
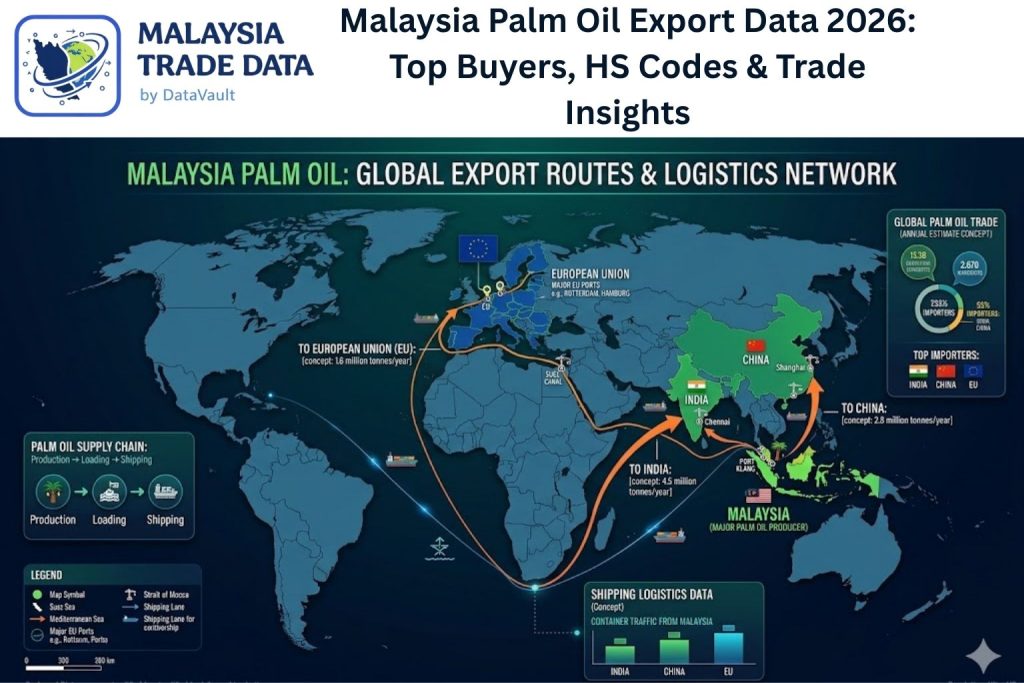
Home › Blog › Malaysia Export Data › Malaysia Palm Oil Export Data 2026 Export Intelligence 2026 Malaysia Palm Oil Export Data 2026: Top Buyers, HS Codes & Trade Insights Malaysia is the world’s second-largest palm oil producer and a dominant global exporter. This comprehensive guide covers Malaysia palm oil export data for 2026 — including top buyer countries, HS code breakdowns, shipment statistics, price trends, and market opportunities for exporters and trade analysts. Updated: April 2026 13 min read Malaysia Export Data $18.2BPalm Oil Export Value 2025 #2World’s Largest Palm Oil Exporter 150+Destination Countries HS 1511Primary Export HS Code MT Malaysia Trade Data Research Team — Data Vault Trade Intelligence Analysts · Published April 21, 2026 · 13 min read Malaysia has long been one of the world’s most important palm oil exporters, and Malaysia palm oil export data for 2026 confirms the country’s continued dominance in global vegetable oil markets. As a critical raw material for food manufacturing, cosmetics, biofuels, and oleochemicals, Malaysian palm oil reaches buyers in over 150 countries — making it one of the most globally traded agricultural commodities on the planet. For exporters, importers, market researchers, and trade analysts, understanding the latest Malaysia palm oil export statistics — including top buyer countries, HS code classifications, shipment volumes, and pricing trends — is essential for competitive positioning in this high-value commodity market. This guide from MalaysiaTradeData.com delivers the most comprehensive analysis of Malaysia palm oil trade intelligence for 2026. Malaysia Palm Oil Export Overview 2026 Malaysia’s palm oil industry is a cornerstone of its agricultural economy and a major driver of export revenue. The country produced approximately 18.5 million metric tonnes of crude palm oil (CPO) in 2025, exporting a significant share in refined, crude, and processed forms to global markets. Total Malaysia palm oil export value reached an estimated $18.2 billion in 2025, accounting for roughly 6% of the country’s total merchandise export revenue. Key Insight: Malaysia and Indonesia together account for over 85% of global palm oil supply. While Indonesia has a larger raw production volume, Malaysia consistently commands a premium in refined and specialty palm oil products — particularly in oleochemicals, fractionated palm oils, and certified sustainable palm oil (CSPO). This quality differentiation is clearly visible in Malaysia palm oil export data by HS code, where refined products (HS 1511.90) command significantly higher unit values than crude exports (HS 1511.10). Businesses tracking regional commodity flows — including those monitoring Malaysia export data across all sectors — will find that palm oil consistently ranks among the top three export categories alongside electronics and petroleum products. The commodity’s price volatility also makes real-time Malaysia palm oil shipment data a critical tool for procurement teams and commodity traders globally. Malaysia Palm Oil Export HS Codes Understanding the correct HS code classifications is fundamental to searching and interpreting Malaysia palm oil export data. Palm oil and its derivatives are classified across several HS chapters depending on the processing stage and product type: HS Code Product Description Export Value (2025) Top Destination Processing Stage Growth 1511.10 Crude Palm Oil (CPO) $4.8B China, India, Pakistan Unrefined +3.2% 1511.90 Refined, Bleached & Deodorised (RBD) Palm Oil $6.4B India, China, EU Refined +5.8% 1511.90.20 RBD Palm Olein (Liquid Fraction) $3.9B India, Pakistan, Bangladesh Fractionated +6.4% 1511.90.30 RBD Palm Stearin (Solid Fraction) $1.2B China, Netherlands, Germany Fractionated +4.1% 1513.21 Crude Palm Kernel Oil (CPKO) $0.9B Netherlands, Germany, USA Unrefined +2.8% 1513.29 Refined Palm Kernel Oil (RPKO) $1.4B Netherlands, Germany, Belgium Refined +7.2% 3823.19 Industrial Fatty Acids (Oleochemicals) $1.6B China, USA, Germany, Japan Processed +11.4% 3826.00 Biodiesel / Palm-based Biofuel $0.7B EU, USA, South Korea Processed +18.6% The standout growth story in Malaysia palm oil HS code export data is HS 3826.00 (Biodiesel, +18.6%) — driven by Malaysia’s B20 biodiesel mandate (20% palm oil blending requirement for transport fuel) and surging EU and US demand for renewable fuel alternatives. The oleochemicals category (HS 3823.19, +11.4%) also shows exceptional growth, reflecting Malaysia’s successful move up the palm oil value chain from crude commodity exporter to specialty chemical supplier. Top Buyer Countries for Malaysia Palm Oil Exports Malaysia’s palm oil export network spans over 150 countries, but the top 8 buyers collectively account for approximately 72% of total export volume. Here is the buyer country breakdown from Malaysia palm oil export statistics 2026: India28.3% China22.1% Pakistan7.4% European Union6.9% Bangladesh4.2% USA3.4% Vietnam2.8% Others24.9% India is by far Malaysia’s largest palm oil buyer, absorbing 28.3% of total export volume — primarily in the form of RBD Palm Olein (HS 1511.90.20) used for cooking oil. India’s massive 1.4 billion population and dependence on imported edible oils makes it a structurally reliable long-term buyer. Businesses tracking Malaysia import data from India will note a reciprocal trade flow — India exports pharmaceuticals and chemicals to Malaysia in exchange for palm oil and petroleum products. China at 22.1% is the second-largest buyer, sourcing primarily crude palm oil (CPO) for industrial processing and refined palm oil for food manufacturing. Analysts cross-referencing Vietnam import data will note that Vietnam also sources Malaysian palm oil — primarily for its growing processed food manufacturing sector — confirming palm oil’s critical role as a regional staple commodity across ASEAN. Malaysia Palm Oil Price Trends 2026 Palm oil price is one of the most closely monitored commodity benchmarks in global agricultural trade. The Bursa Malaysia Derivatives (BMD) exchange sets the benchmark CPO futures price that determines export contract values worldwide. Here is a summary of Malaysia palm oil price data trends for 2025–2026: Quarter Avg CPO Price (MYR/tonne) Avg CPO Price (USD/tonne) Key Price Driver Price Movement Q1 2025 MYR 3,980 ~$870 Strong India demand + La Nina supply disruption ↑ Rising Q2 2025 MYR 4,240 ~$928 Indonesia export levy increase, biodiesel mandate ↑ Rising Q3 2025 MYR 4,580 ~$1,002 Soybean crop shortfall, China stocking ↑ Strong Q4 2025 MYR 4,120 ~$901 Seasonal production peak, profit-taking ↓ Correction Q1 2026 MYR 4,350 ~$952 EU biofuel demand + India pre-monsoon stocking ↑ Recovery The average CPO
Malaysia Export Data by Country: Top Export Markets & Trends
Introduction Malaysia is a major player in global trade, especially in Southeast Asia. The country has built strong export relationships with many international markets, making it an important hub for businesses worldwide. Understanding Malaysia Export Data by Country helps companies identify key export destinations, track product demand, and make better strategic decisions. Businesses can use Malaysia trade data to analyze trends, identify opportunities, and expand globally. This data provides a clear overview of trade patterns and helps companies stay competitive. Top Countries Importing from Malaysia Malaysia exports goods to many countries across the globe. Some of the top export markets include: 1. China China is one of Malaysia’s largest export partners. The country imports electronic goods, palm oil, and industrial products from Malaysia. 2. Singapore Due to its close proximity, Singapore is a major trading partner. Malaysia exports petroleum products, machinery, and consumer goods to Singapore. 3. United States The United States is a key market for Malaysian exports, especially in electronics and manufacturing products. 4. Japan Japan imports machinery, industrial equipment, and raw materials from Malaysia. 5. European Union Countries in the European Union import various Malaysian products, including chemicals, electronics, and processed goods. For official insights, you can also check detailed Malaysia export statistics to understand global trade patterns. Key Products Exported by Malaysia Malaysia’s export economy is supported by a wide range of industries. Some of the major export products include: Businesses can explore detailed Malaysia export data to understand product-level insights and market demand. Importance of Malaysia Export Data by Country Analyzing Malaysia Export Data by Country offers several benefits for businesses: 1. Identify High-Demand Markets Businesses can identify which countries are importing the most from Malaysia and focus on those markets. 2. Find New Business Opportunities Export data helps companies discover new markets and expand their global reach. 3. Understand Market Trends By studying export trends, businesses can predict future demand and adjust their strategies accordingly. 4. Improve Competitive Strategy Companies can analyze competitor activities and improve their own export strategies. How Businesses Can Use Export Data Malaysia export data is a valuable tool for businesses aiming to grow internationally. Companies can use this data to: This helps businesses make data-driven decisions and stay ahead of competitors. Emerging Trends in Malaysia Exports (2025) Global trade is evolving, and Malaysia’s export market is also adapting to new trends. Some key trends include: These trends highlight future opportunities for businesses involved in global trade. Conclusion Malaysia Export Data by Country is essential for understanding global trade dynamics. By analyzing key export markets, product demand, and industry trends, businesses can make informed decisions and achieve long-term growth. Whether you are an exporter, importer, or market analyst, leveraging accurate trade data can help you unlock new opportunities and succeed in international markets. 👉 For more insights, visit: https://malaysiatradedata.com/