Malaysia Solar Panel Export Data 2025 (HS 8541) + Tariffs
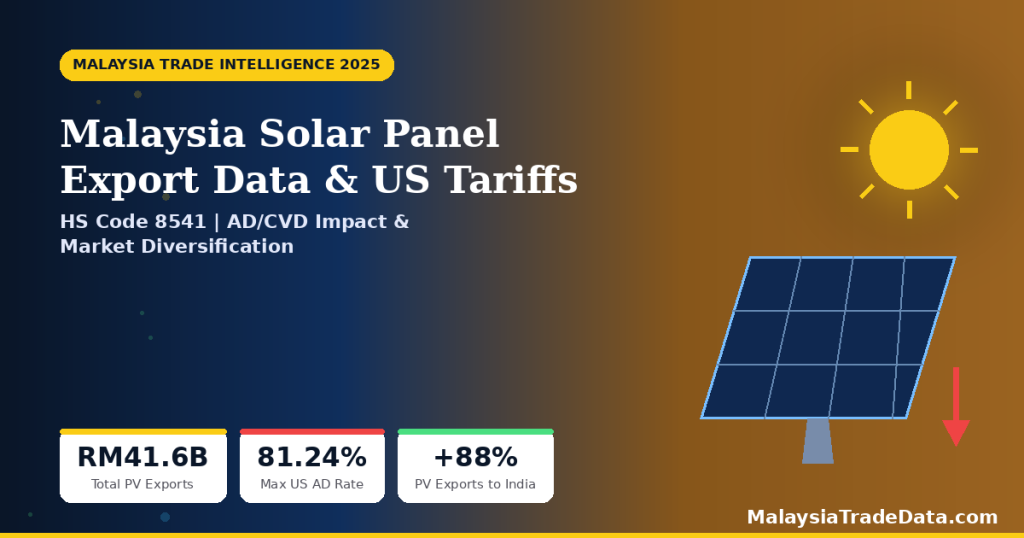
Malaysia Solar Panel Export Data 2025 – HS Code 8541 | US Tariff Impact, Top Markets & Trade Insights ☀️ US Imposes Up to 81.24% AD and 168.8% CVD Tariffs on Malaysian Solar Cells — Exporters Pivot to India & Middle East Malaysia Solar Panel Export Data 2025 – HS Code 8541 | US Tariff Impact, Top Markets & Trade Insights Published: September 19, 2026 | By MalaysiaTradeData Research Team | 12 min read Home › Blog › Malaysia Solar Panel Export Data 2025 – HS Code 8541 Malaysia’s solar export sector is going through its biggest disruption in a decade. After the United States imposed anti-dumping duties of up to 81.24% and countervailing duties of up to 168.8% on Malaysian solar cells in April 2025, exporters have accelerated a pivot toward India, the Middle East, and other emerging markets. This guide covers Malaysia’s verified HS 8541 export figures, the full tariff picture, and where demand is shifting next. Malaysia Solar Panel Export Market Overview Malaysia has been one of Southeast Asia’s largest photovoltaic manufacturing bases for years, serving as a production hub for both Chinese-owned and international solar companies. Malaysia’s exports of PV products totalled RM41.6 billion, representing a 22% increase from the previous year, according to Malaysia External Trade Development Corporation figures. Separately, Malaysia’s solar panel exports specifically were reported at RM11.2 billion in 2024. However, the trade picture has shifted sharply. The United States has historically been Malaysia’s single largest PV market, absorbing 22.9% of Malaysia’s PV product exports. Consequently, the new US duties represent a direct challenge to a substantial share of the sector’s export base, and Malaysian producers have been actively repositioning toward alternative markets. ☀️ Malaysia Solar & PV Export — Key Statistics Metric Value Detail Total PV Product Exports RM41.6 Billion ▲ 22% year-on-year Solar Panel Exports (2024) RM11.2 Billion Reported by Malaysia’s trade ministry US Share of PV Exports 22.9% Largest single destination PV Cell Exports to India (2024) RM4.65 Billion ▲ 88% vs RM2.47B in 2023 Max US Anti-Dumping Rate 81.24% “All others” rate: 8.59% Max US Countervailing Rate 168.8% Lowest CVD: 14.64% (Hanwha Qcells) Source: MalaysiaTradeData.com Research, compiled from official trade reporting and US trade determinations Where Malaysia’s PV Exports Go — Destination Breakdown Malaysia’s PV export base has historically been concentrated in a handful of markets. The United States leads, followed by Singapore and Hong Kong at equal shares, then China, Germany, and Vietnam. As the chart below shows, this concentration is precisely what makes the US tariff decision so consequential for the sector. Destination Share of PV Exports United States 22.9% Singapore 13.1% Hong Kong 13.1% China 11.0% Germany 9.9% Vietnam 7.3% The US Tariff Decision — What Actually Happened On April 21, 2025, the US Department of Commerce issued final affirmative determinations in its anti-dumping and countervailing duty investigations covering crystalline photovoltaic cells from Cambodia, Malaysia, Thailand, and Vietnam. The case had been filed roughly a year earlier by the American Alliance for Solar Manufacturing Trade Committee, a group including Hanwha Qcells, Mission Solar, Meyer Burger, and First Solar. Importantly, Malaysia received the lowest maximum rates of the four countries named. The chart below compares the maximum AD and CVD rates applied to each. Country Max Anti-Dumping (AD) Max Countervailing (CVD) Cambodia 125.37% 3,403.96% Vietnam 271.28% 542.64% Thailand 202.9% 799.55% Malaysia 81.24% 168.8% 1. Rates Vary Significantly by Company The headline maximum figures do not apply uniformly. In Malaysia’s anti-dumping investigation, four of six mandatory respondents received the 81.24% rate based on adverse facts available. However, one respondent received a rate of 0.00%, and another received 8.59%. Notably, the “all others” rate — which applies to exporters not individually investigated — was set at just 8.59%. On the countervailing side, Korean-owned Hanwha Qcells’ Malaysian operation received the lowest CVD rate at 14.64%, alongside a 0% AD margin. 2. The Duties Stack on Top of Other Tariffs Critically, AD/CVD duties are not the only trade measure in play. They stack on top of existing Section 201 solar tariffs, and on top of so-called “reciprocal” tariffs. For Malaysia specifically, the reciprocal tariff took effect in April 2025 at a 10% rate, with a scheduled increase to 24%. Therefore, the effective total tariff burden for some Malaysian shipments can be considerably higher than any single headline rate suggests. 3. The Decline Started Before the Tariffs It’s worth noting that Malaysia’s US solar exports were already softening before the AD/CVD determination. According to Malaysia’s trade ministry, the decline began when the US ended its solar product tax exemption for Southeast Asian countries in June 2024. As a result, the 2025 tariff decision accelerated a trend that was already underway rather than creating it from nothing. 📖 Also Read: Malaysia Semiconductor & Photovoltaic Device Export Data – HS Code 8541 Malaysia Electric Battery & EV Accumulator Trade Data – HS Code 8507 Malaysia Export Data – Complete Trade Intelligence Market Diversification — Where Malaysian Solar Is Heading Next Faced with a narrowing US market, Malaysian exporters and trade authorities have moved decisively toward diversification. The clearest success so far has been India. India: The Standout Growth Market Malaysia’s PV cell exports to India reached RM4.65 billion in 2024, up 88% from RM2.47 billion in 2023. In other words, India nearly doubled its intake in a single year, partially offsetting softening US demand. India’s own aggressive solar deployment targets make it a structurally attractive long-term destination. Middle East: UAE and Saudi Arabia Identified as Priority Markets In addition to India, Malaysia’s trade ministry has explicitly identified the United Arab Emirates and Saudi Arabia as potential growth markets for PV exports. Furthermore, local solar companies have been promoted through the Malaysia International Halal Showcase’s Greentech category as part of this diversification push. Regional Competition Is Intensifying Meanwhile, the competitive landscape is reshuffling quickly. Indonesia and Laos have emerged as significant new suppliers to the US market, with Indonesia’s share of US solar module imports rising sharply in 2025 while Vietnam, Thailand, and Malaysia
Malaysia Electric Battery Export Data 2025 (HS 8507)
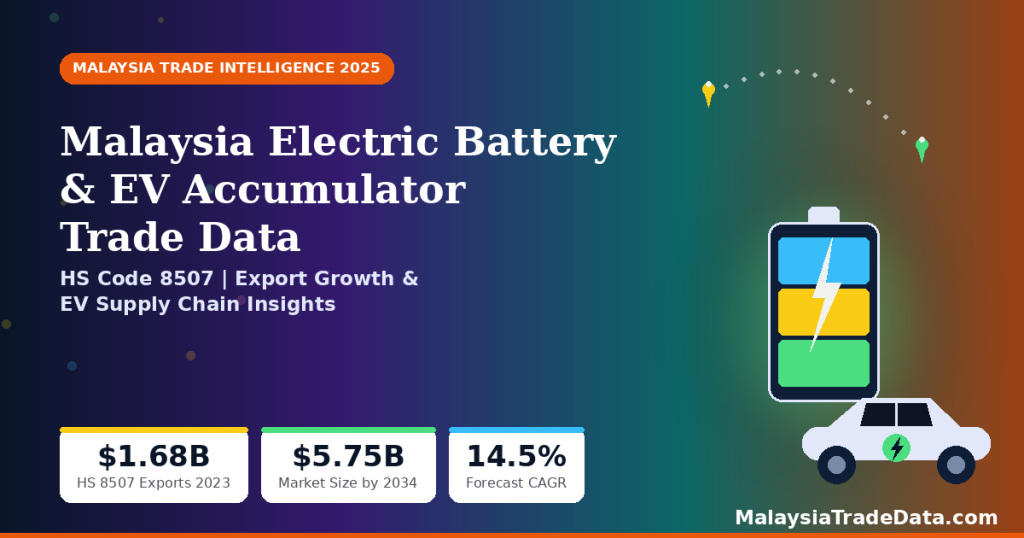
Malaysia Electric Battery & EV Accumulator Trade Data 2025 – HS Code 8507 | Export Growth, EV Supply Chain & Trade Insights 🔋 Malaysia’s EV Battery Supply Chain Market Set to Grow From $1.7B (2025) to $5.75B by 2034 — HS Code 8507 in Focus Malaysia Electric Battery & EV Accumulator Trade Data 2025 – HS Code 8507 | Export Growth, EV Supply Chain & Trade Insights Published: September 12, 2026 | By MalaysiaTradeData Research Team | 11 min read Home › Blog › Malaysia Electric Battery & EV Accumulator Trade Data 2025 – HS Code 8507 Malaysia is rapidly emerging as a Southeast Asian hub for electric battery and EV accumulator manufacturing (HS Code 8507), with more than $4 billion in announced investments flowing into cell production, pack assembly, and recycling infrastructure over the past three years. This guide covers Malaysia’s verified HS 8507 trade figures, the companies driving its EV battery build-out, and where the market is headed through 2034. Malaysia’s Electric Battery Trade Market Overview Malaysia has long been a major assembler of electrical and electronic goods, and this expertise is now extending into batteries. In 2023, Malaysia exported $1.68 billion worth of electric accumulators under HS Code 8507, accounting for 1.41% of the country’s total HS Chapter 85 (electrical machinery) exports, which reached $119.04 billion that year. Meanwhile, Malaysia’s overall electrical machinery imports totalled $72.80 billion in 2023, representing 27% of total merchandise imports. Rather than being a large net importer of finished batteries, Malaysia functions primarily as an export-oriented assembly and component hub. As a result, its growth story centres on manufacturing investment rather than import volume — global battery makers are choosing Malaysia as a base to produce cells and packs for re-export, particularly for the electric vehicle (EV) and energy storage system (ESS) markets. 🔋 Malaysia Electric Battery (HS 8507) Key Statistics Metric Value Detail HS 8507 Export Value (2023) $1.68 Billion 1.41% of HS 85 exports Total HS 85 Exports (2023) $119.04 Billion ▼ 6.96% vs 2022 Total HS 85 Imports (2023) $72.80 Billion ▼ 14.55% vs 2022 Malaysia EV Battery Supply Chain Market (2025) $1.70 Billion Forecast to reach $5.75B by 2034 Forecast CAGR (2026–2034) 14.5% EV battery supply chain segment Announced Investment (last 3 years) $4 Billion+ Cell production, pack assembly, recycling Source: MalaysiaTradeData.com Research, based on 2023 trade statistics (latest verified full-year figures) Malaysia EV Battery Supply Chain — Market Size Forecast 2025–2034 While full-year trade figures for HS 8507 beyond 2023 are still being finalized, industry analysts already track Malaysia’s EV battery supply chain as a distinct, fast-growing segment. Specifically, the market was valued at $1.7 billion in 2025 and is projected to reach $5.75 billion by 2034, growing at a compound annual rate of 14.5%. The chart below plots this forecast trajectory year by year. Year Market Size (Forecast) YoY Growth 2025 $1.70 Billion — 2026 $1.95 Billion ▲ 14.5% 2027 $2.23 Billion ▲ 14.5% 2028 $2.55 Billion ▲ 14.5% 2029 $2.92 Billion ▲ 14.5% 2030 $3.35 Billion ▲ 14.5% 2031 $3.83 Billion ▲ 14.5% 2032 $4.39 Billion ▲ 14.5% 2033 $5.02 Billion ▲ 14.5% 2034 $5.75 Billion ▲ 14.5% Global HS 8507 Battery Trade — Where Malaysia Fits In Globally, trade in electric batteries under HS 8507 reached $150 billion in 2024. In terms of exporters, China led by a wide margin at $76.2 billion, followed by Poland ($8.34 billion) and South Korea ($7.92 billion). On the import side, the United States ($32.2 billion), Germany ($25.2 billion), and Mexico ($5.14 billion) were the largest buyers. Against this backdrop, Malaysia’s $1.68 billion in HS 8507 exports is a relatively modest slice of global trade today — however, it is growing quickly as new manufacturing capacity comes online. One useful bilateral data point: China’s imports of electric accumulators from Malaysia reached $359.66 million in 2024, underscoring Malaysia’s growing role as a component supplier even to the world’s largest battery-producing economy. Companies Driving Malaysia’s Battery Manufacturing Build-Out Malaysia’s battery corridor is concentrated in Kedah, Perak, and Johor, and it is being built by a mix of global and domestic players: 🏭 Key Battery & EV Accumulator Investments in Malaysia # Company / Project Focus Detail 1 EVE Energy Malaysia (Kedah) Cylindrical cells First overseas factory; online Feb 2025; 680M cells/year capacity 2 Enovix Battery manufacturing $1.2B planned factory, phased over 15 years; $70M initial line 3 Panasonic Energy Malaysia Cells for global EV brands Among top 3 suppliers accounting for ~25% of 2025 shipments (with Samsung SDI & GS Yuasa) 4 Samsung SDI Energy Battery cells & packs Part of the leading Malaysia-based supplier group 5 GS Yuasa Battery cells & packs Part of the leading Malaysia-based supplier group 6 Gigafactory Malaysia Sdn Bhd (NanoMalaysia) Graphene-enhanced Li-ion Sepang plant; initial 1 MWh/year; exports targeted from 2027 7 Shenzhen Senior Technology Material Battery separators CNY 5 billion facility in Kulim, Kedah 8 Tesla (regional office) EV supply chain coordination First deal under Malaysia’s Battery Electric Vehicle Global Leaders initiative (2025) Source: MalaysiaTradeData.com Research, compiled from public industry announcements 1. Kedah — Malaysia’s Emerging Battery Corridor Kedah, and Kulim in particular, has become the centre of gravity for Malaysia’s battery build-out. In addition to EVE Energy’s cylindrical cell plant, the state hosts separator and materials suppliers such as Shenzhen Senior Technology Material, which is investing CNY 5 billion in a local facility. Consequently, the state is positioning itself as an integrated cluster covering cells, separators, and downstream assembly. 2. Johor and the Energy Storage System (ESS) Opportunity Meanwhile, Johor is emerging as Malaysia’s fastest-growing battery deployment cluster, driven largely by a rapidly expanding data-center pipeline that requires grid-scale energy storage. As a result, demand for stationary storage batteries is rising alongside EV-specific demand, giving Malaysia two distinct growth engines rather than one. 3. Domestic Innovation: Graphene-Enhanced Batteries Beyond foreign direct investment, Malaysia is also developing homegrown battery technology. NanoMalaysia’s Gigafactory Malaysia subsidiary has begun small-scale production of graphene-enhanced lithium-ion batteries at its Sepang plant, with initial capacity of 1 MWh
Malaysia Bird’s Nest Export Data – China Trade Guide
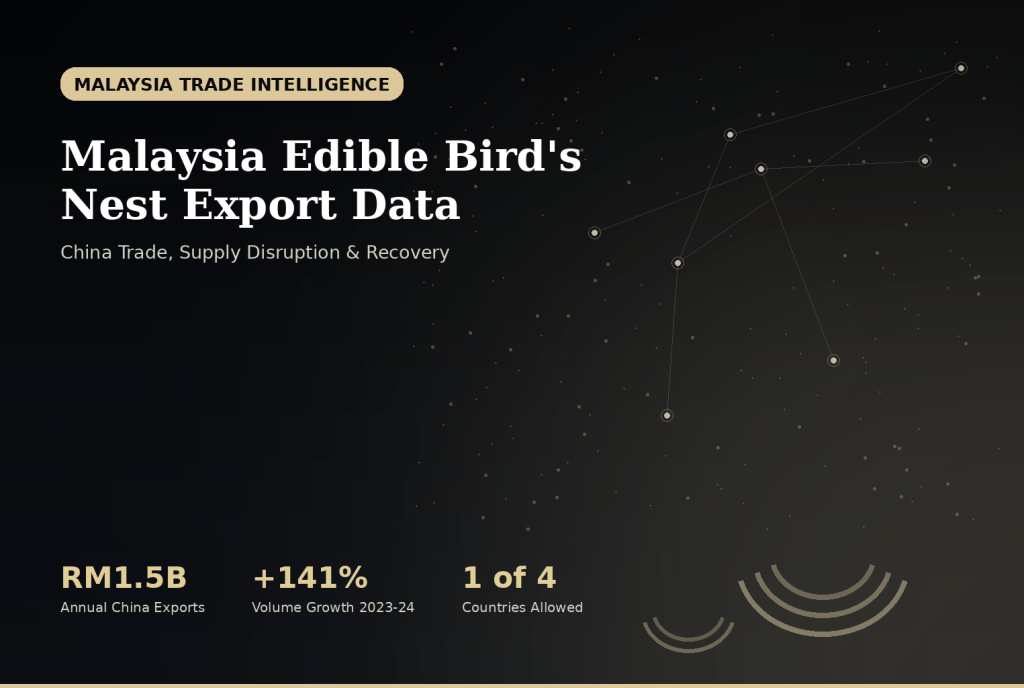
Malaysia Edible Bird’s Nest Export Data – China Trade Guide 🕊️ Malaysia’s Bird’s Nest Exports to China Jumped 141% After a Christmas Disease Scare Nearly Halted Peak-Season Shipments Home › Blog › Malaysia Edible Bird’s Nest Export Data Malaysia’s edible bird’s nest exports to China grew 141% in volume between 2023 and 2024, part of an industry worth an estimated RM1.5 to RM2.2 billion annually. Just weeks after that milestone, however, a disease scare temporarily halted shipments during the industry’s most critical selling period. This guide covers the trade trend, the disruption, and Malaysia’s recovery. Malaysia Edible Bird’s Nest Export Market Overview Edible bird’s nest, harvested from the dried saliva structures built by swiftlets, has grown from a traditional delicacy into a global health and beauty product, prized for its perceived nutritional and skin-health benefits. China accounts for more than 96% of global consumption, making it by far the most important market for producing countries. Malaysia is one of only four countries permitted to export bird’s nest products to China, alongside Indonesia, Thailand, and Vietnam. Malaysia’s bird’s nest industry is estimated to be worth between RM1.5 billion and RM2.2 billion annually (roughly $330 million to $490 million), with exports to China alone reaching approximately RM1.5 billion (about $330 million) per year. The industry supports more than 15,000 registered swiftlet house operators and dozens of certified processing plants nationwide. 🕊️ Malaysia Edible Bird’s Nest Export Key Statistics Metric Value Annual Industry Value RM1.5–2.2 Billion (~$330–490M) Annual China Export Value ~RM1.5 Billion (~$330M) Export Volume to China (2023) 201 Tonnes Export Volume to China (2024) 484 Tonnes Volume Growth (2023–2024) ▲ 140.8% China’s Share of Global Consumption >96% Source: MalaysiaTradeData.com Research The Christmas Disruption: A Near Miss for Peak Season Just as the industry was celebrating its strongest growth in years, exports to China were temporarily suspended starting December 25, 2024, following concerns over a Newcastle disease outbreak detected in poultry, even though no cases were ultimately found among swiftlets themselves. The timing was especially costly: this period falls right before Chinese New Year, the industry’s peak shipping season. Industry representatives reported that roughly 15 tonnes of product worth around RM50 million became unsellable during the halt, with shipments already in transit left awaiting clearance. Following science-based discussions between Malaysia and China, exports resumed in January 2025. Later that year, both countries signed a new long-term protocol on inspection, quarantine, and hygiene requirements, replacing earlier agreements from 2012 and 2016 and aiming to guarantee continued, stable market access going forward. 📖 Also Read: Malaysia Durian Export Data – Musang King’s China Boom Malaysia Export Data Malaysia Import Export Data | Complete Trade Guide The Global Bird’s Nest Market Opportunity The global edible bird’s nest market was valued at approximately $8.46 billion in 2025 and is projected to grow to around $19 billion by 2035. China’s own bird’s nest imports have grown consistently for years, rising from 352.5 tonnes in 2021 to 455 tonnes across the first eleven months of 2022 alone, a 45% year-on-year increase. Given this sustained demand growth and Malaysia’s limited-competition position as one of only four approved exporters, the long-term opportunity for Malaysian producers remains substantial. What’s Shaping Malaysia’s Bird’s Nest Export Trade 1. Restricted Market Access as a Competitive Advantage Because only four countries currently hold approval to export bird’s nest to China, Malaysia benefits from limited competition in the world’s dominant consumption market. Consequently, this restricted access functions as a genuine trade barrier that protects existing exporters from broader global competition. 2. Rising Health and Wellness Demand in China As disposable incomes rise and interest in traditional wellness products grows, bird’s nest has shifted from a luxury delicacy toward a more broadly consumed health product in China. Therefore, this demand shift supports sustained volume growth beyond what pure luxury positioning alone would provide. 3. Formalized Traceability and Compliance Systems Malaysia has implemented tracking systems monitoring thousands of registered swiftlet houses to ensure quality compliance and transparency. As a result, this infrastructure helps build the kind of trust required to sustain long-term market access agreements with China, particularly following disease-related disruptions. 🔍 Get Verified Malaysia Trade Data Access shipment-level Malaysia import/export data with HS codes, buyer details, supplier names, and trade records. Perfect for market research, competitor analysis & B2B lead generation. Explore Malaysia Trade Data → What to Watch Going Forward Despite the strong recovery, however, the December 2024 disruption is a reminder that Malaysia’s bird’s nest trade remains vulnerable to animal-health-related trade barriers, even when actual contamination risk turns out to be limited. For example, any future disease scare, whether confirmed or precautionary, could again halt shipments during peak seasons with significant financial impact on exporters. Furthermore, since China maintains strict, evolving inspection and hygiene protocols, sustained compliance investment will likely remain necessary to preserve Malaysia’s market access advantage over time. Frequently Asked Questions (FAQs) How much is Malaysia’s bird’s nest industry worth? Malaysia’s edible bird’s nest industry is estimated to be worth between RM1.5 billion and RM2.2 billion annually (roughly $330 million to $490 million), with exports to China alone accounting for about RM1.5 billion (approximately $330 million) per year. Why were Malaysia’s bird’s nest exports to China suspended in late 2024? Exports were temporarily halted starting December 25, 2024, due to concerns over a Newcastle disease outbreak detected in poultry, even though no cases were ultimately found among swiftlets. Exports resumed in January 2025 following science-based discussions between Malaysia and China. Which countries are allowed to export bird’s nest to China? Only four countries currently hold approval to export edible bird’s nest products to China: Malaysia, Indonesia, Thailand, and Vietnam. China accounts for more than 96% of global bird’s nest consumption. How fast is Malaysia’s bird’s nest export volume to China growing? Export volume to China grew from 201 tonnes in 2023 to 484 tonnes in 2024, an increase of roughly 141%, reflecting strong demand growth even before accounting for the temporary disruption that followed shortly after. How can I access Malaysia’s bird’s
Malaysia Rubber Glove Export Data – HS Code 4015
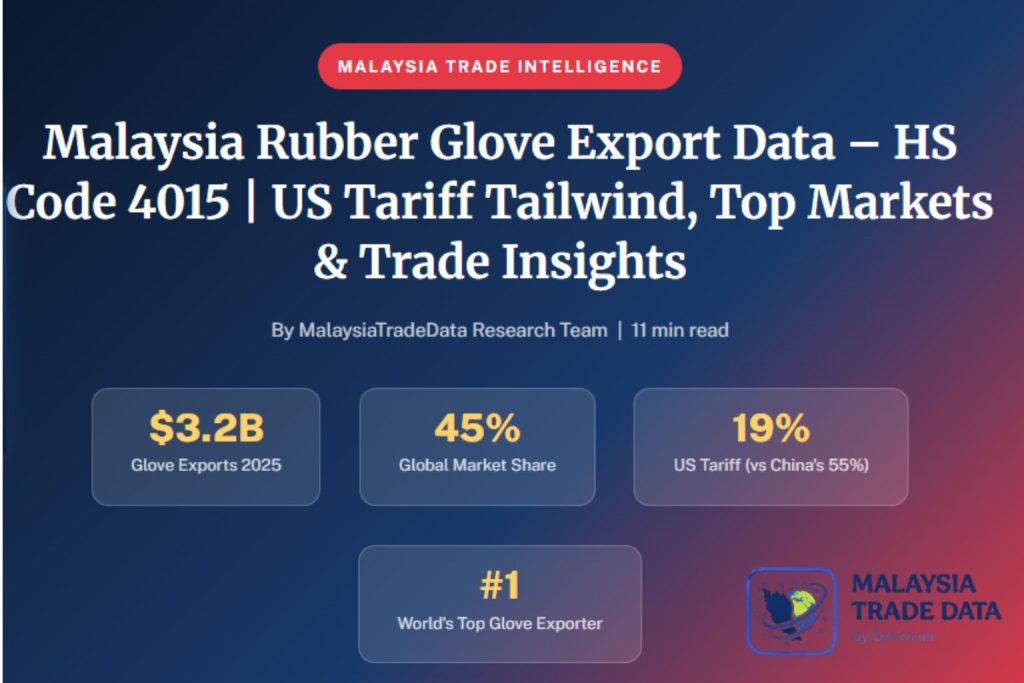
Malaysia Rubber Glove Export Data – HS Code 4015 Guide 🧤 Malaysia Rubber Glove Exports Hold Steady at $3.2 Billion in 2025 as US Tariffs on Chinese Gloves Jump to 55% Malaysia Trade Intelligence Malaysia Rubber Glove Export Data – HS Code 4015 | US Tariff Tailwind, Top Markets & Trade Insights By MalaysiaTradeData Research Team | 11 min read $3.2B Glove Exports 2025 45% Global Market Share 19% US Tariff (vs China’s 55%) #1 World’s Top Glove Exporter Home › Blog › Malaysia Rubber Glove Export Data – HS Code 4015 Malaysia’s rubber glove exports (HS Code 4015) held steady at roughly $3.2 billion in 2025, capturing an estimated 45% of the global glove market. Behind that stable headline number sits one of the most dramatic boom-bust-recovery cycles in Malaysian trade — and a fresh US tariff shift that could reshape the industry’s next few years. This guide covers the full trend, top export markets, and the tariff story every buyer and sourcing manager should know. Malaysia Rubber Glove Export Market Overview Malaysia is the world’s largest exporter of rubber gloves, built on a production ecosystem of major manufacturers including Top Glove, Hartalega, Kossan, and Supermax. For decades, this sector has been a cornerstone of Malaysia’s commodities trade. However, few export categories have swung as violently as rubber gloves did between 2020 and 2023. The COVID-19 pandemic triggered an extraordinary demand spike. As a result, exports rocketed from roughly $8.6 billion in 2020 to a record $13.2 billion in 2021. Once pandemic-era demand normalized, however, the correction was equally dramatic. Exports fell to around $4.3 billion in 2022, then to just $2.6 billion in 2023 — a nearly 80% decline from the 2021 peak. Since then, the industry has stabilized and modestly recovered, reaching approximately $3.2 billion in 2025. 🧤 Malaysia Rubber Glove (HS 4015) Export Key Statistics — 2025 Metric Value Total Glove Export Value (2025) ~$3.2 Billion (RM14.0B) Global Market Share ~45% Peak Export Year 2021 — $13.2 Billion Post-Pandemic Low 2023 — $2.6 Billion US Tariff on Malaysian Gloves (2025) 19% US Tariff on Chinese Gloves (2025) 55% Source: MalaysiaTradeData.com Research Malaysia Rubber Glove Export Value — 2020 to 2025 Trend Few Malaysian export categories illustrate the pandemic’s economic whiplash as clearly as rubber gloves. Exports more than doubled between 2020 and 2021 as global healthcare systems scrambled for supply. Then, over the following two years, values collapsed by nearly 80% as demand normalized and global oversupply set in. Since 2024, however, the sector has found a steadier footing, growing modestly each year. 📊 Malaysia Rubber Glove (HS 4015) Export Value — 2020 to 2025 (USD Billion) 2020$8.6B 2021$13.2B ★ 2022$4.3B 2023$2.6B 2024$3.0B 2025$3.2B Source: MalaysiaTradeData Research (RM converted to USD) Year Export Value (USD) YoY Growth 2020 $8.6 Billion — 2021 $13.2 Billion ▲ 52.6% 2022 $4.3 Billion ▼ 65.3% 2023 $2.6 Billion ▼ 37.9% 2024 $3.0 Billion ▲ 16.1% 2025 $3.2 Billion ▲ 2.2% Malaysia’s Top Rubber Glove Export Markets The United States and the European Union have consistently been Malaysia’s two largest glove markets. In fact, together they absorbed roughly 61.5% of Malaysia’s total glove exports during the 2021 pandemic peak, when the US alone purchased approximately $5.16 billion worth of Malaysian gloves in a single year. By 2023, the US still accounted for around 35% of Malaysia’s total glove exports. 🌍 Malaysia’s Rubber Glove Market Share of US Imports — 2020 vs 2025 🇺🇸 US Share 2020–2023 Avg Malaysia 55% 🇺🇸 US Share Currently (2025) Malaysia 44% Source: MalaysiaTradeData.com — Malaysia’s share of total US glove imports (not share of Malaysia’s exports) Why Malaysia’s US Market Share Slipped — Then Why It May Recover Malaysia’s share of the US glove import market fell from an average of 55% (2020–2023) to around 44% currently, as Chinese manufacturers undercut prices during the post-pandemic oversupply period. Notably, however, this trend may be reversing. The US raised tariffs on Chinese-made medical gloves from 7.5% to 50% in 2025, with a further increase to 100% planned for 2026. Meanwhile, as of mid-2025, Malaysian and Thai goods face a considerably lower 19% US tariff, versus 55% for China under the broader tariff framework — giving Malaysian exporters a meaningful pricing advantage heading into 2026. 📖 Also Read: Malaysia Rubber Export Data See Malaysia’s broader semiconductor export trends Malaysia Import Export Data | Complete Trade Guide A Note on HS Code Scope: Gloves vs. Surgical Gloves Specifically HS Code 4015 covers all rubber gloves broadly — medical examination gloves, industrial gloves, and household gloves alike. A narrower sub-classification, HS 401511 (rubber surgical gloves specifically), tells a related but distinct story. According to global trade data, Malaysia exported approximately $2.19 billion worth of surgical gloves specifically in 2024, ahead of China ($1.41 billion) and Thailand ($886 million) — confirming Malaysia’s leadership even within this more specific product category. What’s Driving the Rubber Glove Trade Story Now 1. The US-China Tariff Gap The single biggest near-term factor is the widening tariff gap between Malaysia and China in the US market. As Chinese medical glove tariffs climb toward 100% by 2026, Malaysian manufacturers gain a substantial cost advantage. Consequently, industry observers widely expect this to help Malaysia recover lost US market share. 2. Post-Pandemic Demand Normalization The dramatic 2022–2023 decline mainly reflected the unwinding of pandemic-era stockpiling and oversupply, rather than a genuine collapse in underlying demand. Therefore, the 2024–2025 stabilization likely represents a return to a more sustainable, structurally higher demand baseline than pre-pandemic levels. 3. Raw Material and Supply Chain Pressure More recently, however, the industry has faced new cost pressures. Disruptions in the Strait of Hormuz have pushed up Brent crude prices, which directly affects the cost of nitrile butadiene rubber (NBR) — the primary raw material for nitrile gloves. As a result, manufacturers are managing rising input costs even as export volumes stabilize. 🔍 Get Verified Malaysia Trade Data Access shipment-level Malaysia import/export data with HS codes, buyer details, supplier names, and trade records. Perfect for market
Malaysia Palm Oil Export Data 2026: Top Buyers, HS Codes & Trade Insights
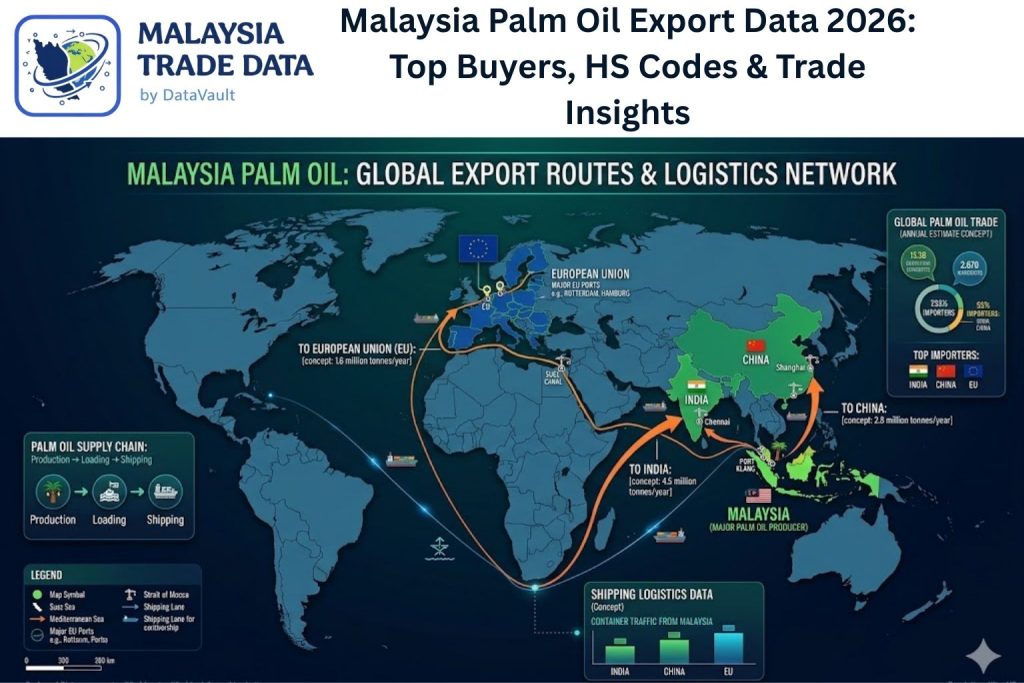
Home › Blog › Malaysia Export Data › Malaysia Palm Oil Export Data 2026 Export Intelligence 2026 Malaysia Palm Oil Export Data 2026: Top Buyers, HS Codes & Trade Insights Malaysia is the world’s second-largest palm oil producer and a dominant global exporter. This comprehensive guide covers Malaysia palm oil export data for 2026 — including top buyer countries, HS code breakdowns, shipment statistics, price trends, and market opportunities for exporters and trade analysts. Updated: April 2026 13 min read Malaysia Export Data $18.2BPalm Oil Export Value 2025 #2World’s Largest Palm Oil Exporter 150+Destination Countries HS 1511Primary Export HS Code MT Malaysia Trade Data Research Team — Data Vault Trade Intelligence Analysts · Published April 21, 2026 · 13 min read Malaysia has long been one of the world’s most important palm oil exporters, and Malaysia palm oil export data for 2026 confirms the country’s continued dominance in global vegetable oil markets. As a critical raw material for food manufacturing, cosmetics, biofuels, and oleochemicals, Malaysian palm oil reaches buyers in over 150 countries — making it one of the most globally traded agricultural commodities on the planet. For exporters, importers, market researchers, and trade analysts, understanding the latest Malaysia palm oil export statistics — including top buyer countries, HS code classifications, shipment volumes, and pricing trends — is essential for competitive positioning in this high-value commodity market. This guide from MalaysiaTradeData.com delivers the most comprehensive analysis of Malaysia palm oil trade intelligence for 2026. Malaysia Palm Oil Export Overview 2026 Malaysia’s palm oil industry is a cornerstone of its agricultural economy and a major driver of export revenue. The country produced approximately 18.5 million metric tonnes of crude palm oil (CPO) in 2025, exporting a significant share in refined, crude, and processed forms to global markets. Total Malaysia palm oil export value reached an estimated $18.2 billion in 2025, accounting for roughly 6% of the country’s total merchandise export revenue. Key Insight: Malaysia and Indonesia together account for over 85% of global palm oil supply. While Indonesia has a larger raw production volume, Malaysia consistently commands a premium in refined and specialty palm oil products — particularly in oleochemicals, fractionated palm oils, and certified sustainable palm oil (CSPO). This quality differentiation is clearly visible in Malaysia palm oil export data by HS code, where refined products (HS 1511.90) command significantly higher unit values than crude exports (HS 1511.10). Businesses tracking regional commodity flows — including those monitoring Malaysia export data across all sectors — will find that palm oil consistently ranks among the top three export categories alongside electronics and petroleum products. The commodity’s price volatility also makes real-time Malaysia palm oil shipment data a critical tool for procurement teams and commodity traders globally. Malaysia Palm Oil Export HS Codes Understanding the correct HS code classifications is fundamental to searching and interpreting Malaysia palm oil export data. Palm oil and its derivatives are classified across several HS chapters depending on the processing stage and product type: HS Code Product Description Export Value (2025) Top Destination Processing Stage Growth 1511.10 Crude Palm Oil (CPO) $4.8B China, India, Pakistan Unrefined +3.2% 1511.90 Refined, Bleached & Deodorised (RBD) Palm Oil $6.4B India, China, EU Refined +5.8% 1511.90.20 RBD Palm Olein (Liquid Fraction) $3.9B India, Pakistan, Bangladesh Fractionated +6.4% 1511.90.30 RBD Palm Stearin (Solid Fraction) $1.2B China, Netherlands, Germany Fractionated +4.1% 1513.21 Crude Palm Kernel Oil (CPKO) $0.9B Netherlands, Germany, USA Unrefined +2.8% 1513.29 Refined Palm Kernel Oil (RPKO) $1.4B Netherlands, Germany, Belgium Refined +7.2% 3823.19 Industrial Fatty Acids (Oleochemicals) $1.6B China, USA, Germany, Japan Processed +11.4% 3826.00 Biodiesel / Palm-based Biofuel $0.7B EU, USA, South Korea Processed +18.6% The standout growth story in Malaysia palm oil HS code export data is HS 3826.00 (Biodiesel, +18.6%) — driven by Malaysia’s B20 biodiesel mandate (20% palm oil blending requirement for transport fuel) and surging EU and US demand for renewable fuel alternatives. The oleochemicals category (HS 3823.19, +11.4%) also shows exceptional growth, reflecting Malaysia’s successful move up the palm oil value chain from crude commodity exporter to specialty chemical supplier. Top Buyer Countries for Malaysia Palm Oil Exports Malaysia’s palm oil export network spans over 150 countries, but the top 8 buyers collectively account for approximately 72% of total export volume. Here is the buyer country breakdown from Malaysia palm oil export statistics 2026: India28.3% China22.1% Pakistan7.4% European Union6.9% Bangladesh4.2% USA3.4% Vietnam2.8% Others24.9% India is by far Malaysia’s largest palm oil buyer, absorbing 28.3% of total export volume — primarily in the form of RBD Palm Olein (HS 1511.90.20) used for cooking oil. India’s massive 1.4 billion population and dependence on imported edible oils makes it a structurally reliable long-term buyer. Businesses tracking Malaysia import data from India will note a reciprocal trade flow — India exports pharmaceuticals and chemicals to Malaysia in exchange for palm oil and petroleum products. China at 22.1% is the second-largest buyer, sourcing primarily crude palm oil (CPO) for industrial processing and refined palm oil for food manufacturing. Analysts cross-referencing Vietnam import data will note that Vietnam also sources Malaysian palm oil — primarily for its growing processed food manufacturing sector — confirming palm oil’s critical role as a regional staple commodity across ASEAN. Malaysia Palm Oil Price Trends 2026 Palm oil price is one of the most closely monitored commodity benchmarks in global agricultural trade. The Bursa Malaysia Derivatives (BMD) exchange sets the benchmark CPO futures price that determines export contract values worldwide. Here is a summary of Malaysia palm oil price data trends for 2025–2026: Quarter Avg CPO Price (MYR/tonne) Avg CPO Price (USD/tonne) Key Price Driver Price Movement Q1 2025 MYR 3,980 ~$870 Strong India demand + La Nina supply disruption ↑ Rising Q2 2025 MYR 4,240 ~$928 Indonesia export levy increase, biodiesel mandate ↑ Rising Q3 2025 MYR 4,580 ~$1,002 Soybean crop shortfall, China stocking ↑ Strong Q4 2025 MYR 4,120 ~$901 Seasonal production peak, profit-taking ↓ Correction Q1 2026 MYR 4,350 ~$952 EU biofuel demand + India pre-monsoon stocking ↑ Recovery The average CPO
Malaysia Export Data by Country: Top Export Markets & Trends
Introduction Malaysia is a major player in global trade, especially in Southeast Asia. The country has built strong export relationships with many international markets, making it an important hub for businesses worldwide. Understanding Malaysia Export Data by Country helps companies identify key export destinations, track product demand, and make better strategic decisions. Businesses can use Malaysia trade data to analyze trends, identify opportunities, and expand globally. This data provides a clear overview of trade patterns and helps companies stay competitive. Top Countries Importing from Malaysia Malaysia exports goods to many countries across the globe. Some of the top export markets include: 1. China China is one of Malaysia’s largest export partners. The country imports electronic goods, palm oil, and industrial products from Malaysia. 2. Singapore Due to its close proximity, Singapore is a major trading partner. Malaysia exports petroleum products, machinery, and consumer goods to Singapore. 3. United States The United States is a key market for Malaysian exports, especially in electronics and manufacturing products. 4. Japan Japan imports machinery, industrial equipment, and raw materials from Malaysia. 5. European Union Countries in the European Union import various Malaysian products, including chemicals, electronics, and processed goods. For official insights, you can also check detailed Malaysia export statistics to understand global trade patterns. Key Products Exported by Malaysia Malaysia’s export economy is supported by a wide range of industries. Some of the major export products include: Businesses can explore detailed Malaysia export data to understand product-level insights and market demand. Importance of Malaysia Export Data by Country Analyzing Malaysia Export Data by Country offers several benefits for businesses: 1. Identify High-Demand Markets Businesses can identify which countries are importing the most from Malaysia and focus on those markets. 2. Find New Business Opportunities Export data helps companies discover new markets and expand their global reach. 3. Understand Market Trends By studying export trends, businesses can predict future demand and adjust their strategies accordingly. 4. Improve Competitive Strategy Companies can analyze competitor activities and improve their own export strategies. How Businesses Can Use Export Data Malaysia export data is a valuable tool for businesses aiming to grow internationally. Companies can use this data to: This helps businesses make data-driven decisions and stay ahead of competitors. Emerging Trends in Malaysia Exports (2025) Global trade is evolving, and Malaysia’s export market is also adapting to new trends. Some key trends include: These trends highlight future opportunities for businesses involved in global trade. Conclusion Malaysia Export Data by Country is essential for understanding global trade dynamics. By analyzing key export markets, product demand, and industry trends, businesses can make informed decisions and achieve long-term growth. Whether you are an exporter, importer, or market analyst, leveraging accurate trade data can help you unlock new opportunities and succeed in international markets. 👉 For more insights, visit: https://malaysiatradedata.com/